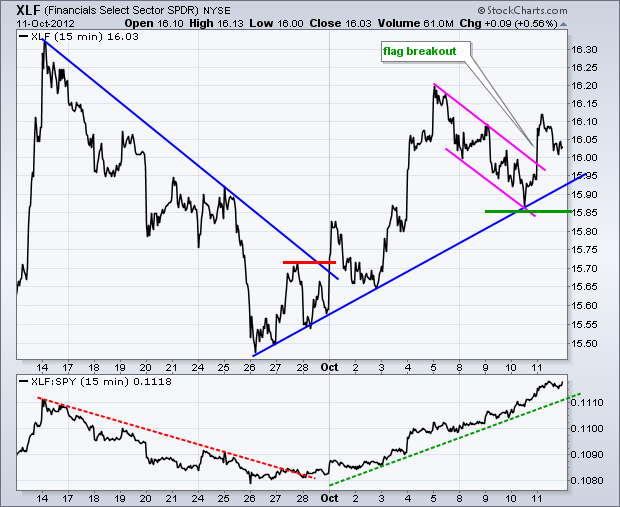
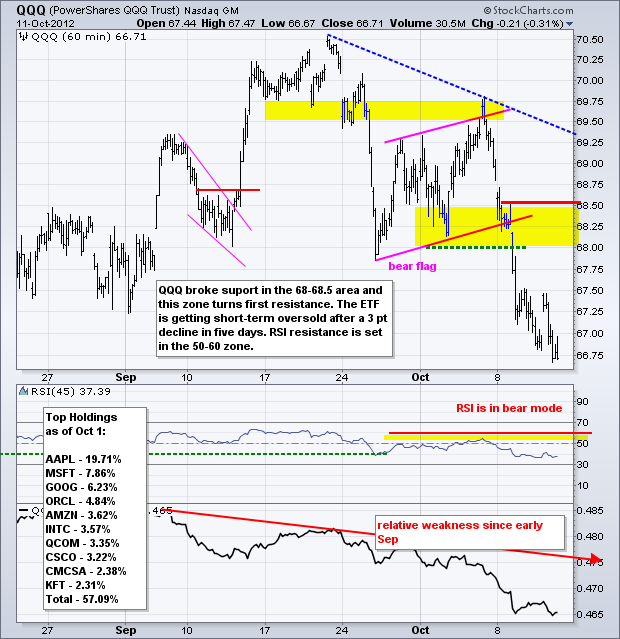
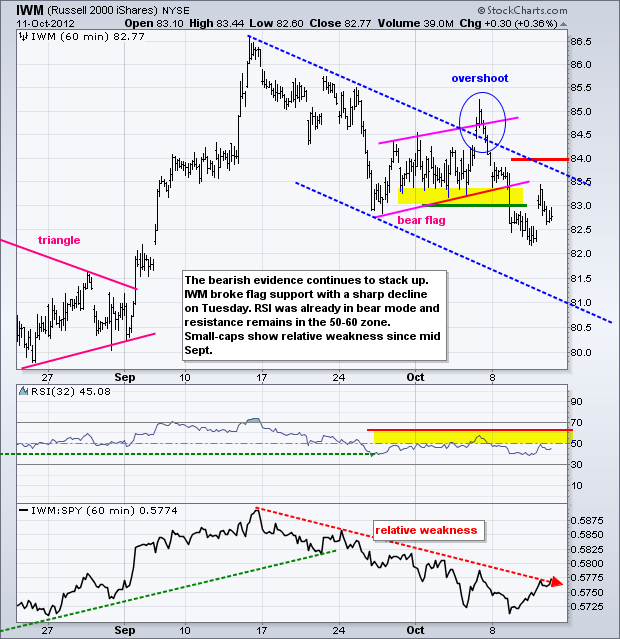
Stocks started the day strong, but selling pressure took hold and the market finished mixed. Just how mixed? The Nasdaq 100 ETF (QQQ) edged lower (-.31%), but the Nasdaq 100 Equal-Weight ETF (QQEW) edged higher (+.35%). The sectors were also mixed with six up and three down. The Technology SPDR (XLK) and the Consumer Discretionary SPDR (XLY) were on the losing side, which is negative for the market as a whole. The Finance SPDR (XLF) edged higher ahead of earnings from JP Morgan and Wells Fargo on Friday. On the short-term price chart, XLF broke flag resistance and this breakout is holding so far. Key support is set at 15.85 and a break below this level would reverse the short-term uptrend, which has been in place since late September. Notice that the price relative (XLF:SPY ratio) turned up in late September and XLF has been outperforming in October.

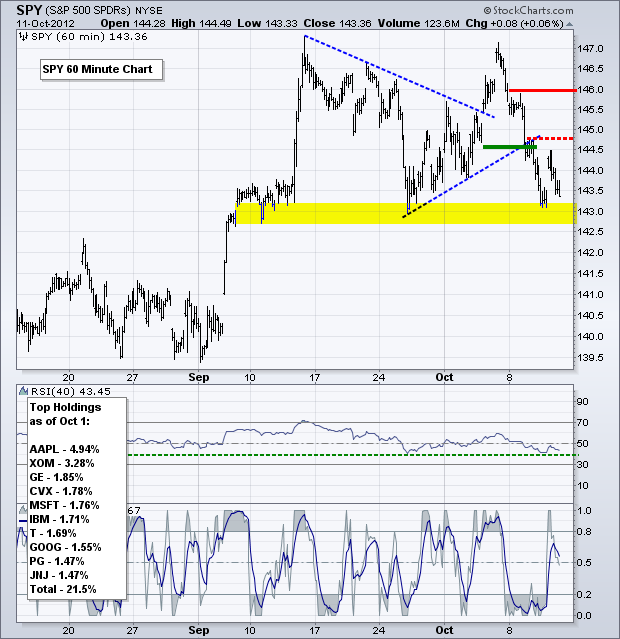
On the 60-minute chart, SPY surged on the open, but quickly peaked and moved lower throughout the day. Even though the ETF closed slightly higher, this pop and drop price action is negative. Thursday's high affirms resistance from broken support. I will leave key resistance at 146 for now.
**************************************************************************
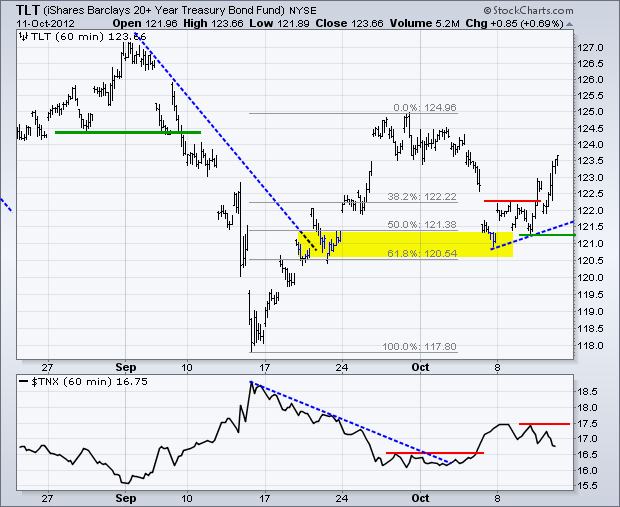
No change. Unsurprisingly, the 20+ Year T-Bond ETF (TLT) surged because stocks remained weak. Treasuries represent the risk-off trade and the safe-haven alternative to stocks. TLT firmed in the retracement zone and broke resistance with a surge above 122.50 on Wednesday. I think this breakout is short-term bullish and treasuries will remain strong as long as stocks and the Euro weaken. This week's low mark support at 121.20.
**************************************************************************
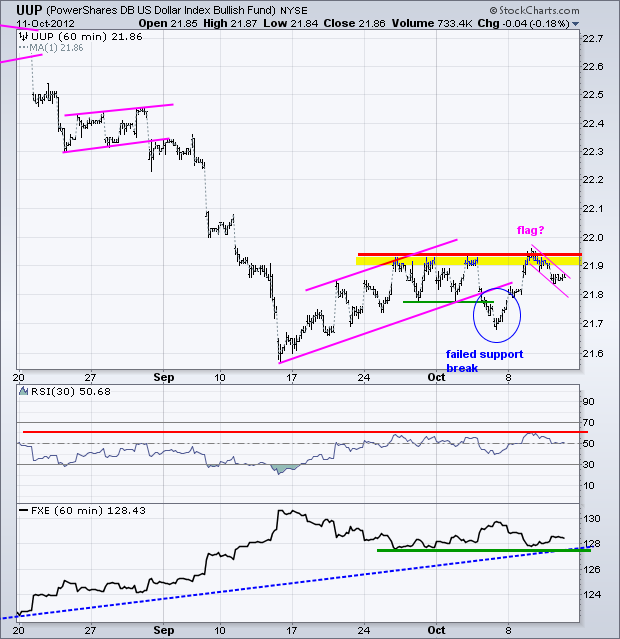
No change. The risk-off trade was also buoyed by a surge in the Dollar. The US Dollar Fund (UUP) failed to hold the channel break and surged to resistance in the 21.95 area. The failed break is positive and a follow through breakout would be bullish for the Dollar. RSI is also challenging resistance at 60 and a breakout would turn momentum bullish. An uptrend in the Dollar would be bearish for stocks, and possibly gold.
**************************************************************************
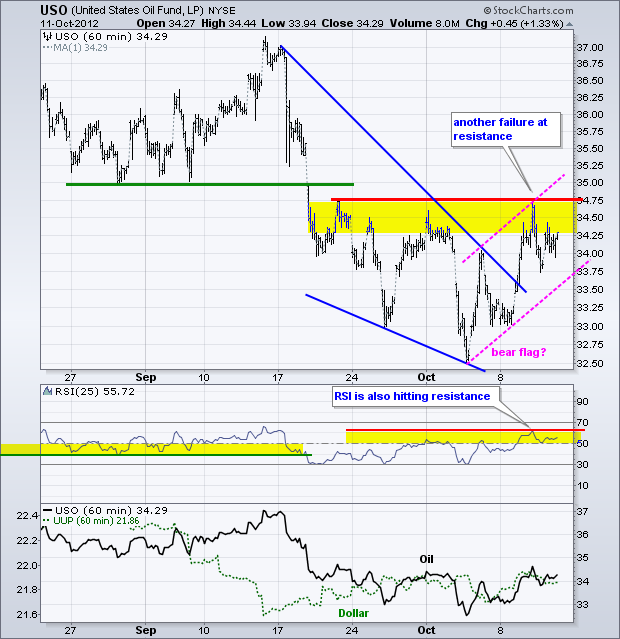
No change. It is hard to ignore the day-to-day swings in oil, but I am not going to turn bullish on this trend line break just yet. The US Oil Fund (USO) surged above 34 and broke the falling wedge trend line. Even though this is positive, I think resistance in the 34.5-34.75 area holds the real key here. RSI is in its resistance zone and has yet to break above 60. Also note oil could be weighed down by weakness in stocks and strength in the Dollar.
**************************************************************************
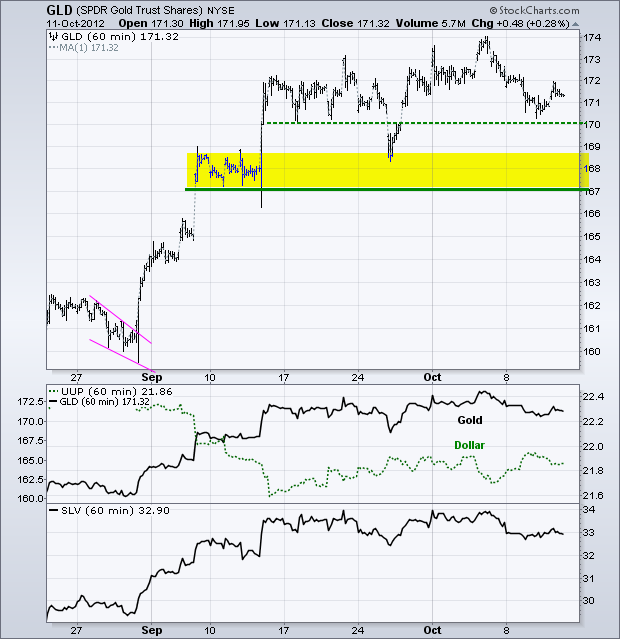
No change. Weakness in stocks and strength in the Dollar did weigh on gold. The Gold SPDR (GLD) fell from 174 to 171 over the last three days. The overall trend remains up, but traders should watch the Dollar closely in the next few days. Even though GLD may have support in the 170 area, I am going to leave key support at 167-168 for now. The idea is to avoid whipsaws from the noise (volatility). A break below 167 would be deemed excessive and call for a trend reversal.
**************************************************************************
Key Reports and Events:
Fri - Oct 12 - 08:30 – Producer Price Index (PPI)
Fri - Oct 12 - 09:55 - Michigan Sentiment
Thu – Oct 18 – 09:00 – EU Summit
Fri – Oct 19 – 09:00 – EU Summit
Charts of Interest: Tuesday and Thursday
This commentary and charts-of-interest are designed to stimulate thinking. This analysis is not a recommendation to buy, sell, hold or sell short any security (stock ETF or otherwise). We all need to think for ourselves when it comes to trading our own accounts. First, it is the only way to really learn. Second, we are the only ones responsible for our decisions. Think of these charts as food for further analysis. Before making a trade, it is important to have a plan. Plan the trade and trade the plan. Among other things, this includes setting a trigger level, a target area and a stop-loss level. It is also important to plan for three possible price movements: advance, decline or sideways. Have a plan for all three scenarios BEFORE making the trade. Consider possible holding times. And finally, look at overall market conditions and sector/industry performance.


**************************************************************************
No change. Unsurprisingly, the 20+ Year T-Bond ETF (TLT) surged because stocks remained weak. Treasuries represent the risk-off trade and the safe-haven alternative to stocks. TLT firmed in the retracement zone and broke resistance with a surge above 122.50 on Wednesday. I think this breakout is short-term bullish and treasuries will remain strong as long as stocks and the Euro weaken. This week's low mark support at 121.20.

**************************************************************************
No change. The risk-off trade was also buoyed by a surge in the Dollar. The US Dollar Fund (UUP) failed to hold the channel break and surged to resistance in the 21.95 area. The failed break is positive and a follow through breakout would be bullish for the Dollar. RSI is also challenging resistance at 60 and a breakout would turn momentum bullish. An uptrend in the Dollar would be bearish for stocks, and possibly gold.

**************************************************************************
No change. It is hard to ignore the day-to-day swings in oil, but I am not going to turn bullish on this trend line break just yet. The US Oil Fund (USO) surged above 34 and broke the falling wedge trend line. Even though this is positive, I think resistance in the 34.5-34.75 area holds the real key here. RSI is in its resistance zone and has yet to break above 60. Also note oil could be weighed down by weakness in stocks and strength in the Dollar.

**************************************************************************
No change. Weakness in stocks and strength in the Dollar did weigh on gold. The Gold SPDR (GLD) fell from 174 to 171 over the last three days. The overall trend remains up, but traders should watch the Dollar closely in the next few days. Even though GLD may have support in the 170 area, I am going to leave key support at 167-168 for now. The idea is to avoid whipsaws from the noise (volatility). A break below 167 would be deemed excessive and call for a trend reversal.

**************************************************************************
Key Reports and Events:
Fri - Oct 12 - 08:30 – Producer Price Index (PPI)
Fri - Oct 12 - 09:55 - Michigan Sentiment
Thu – Oct 18 – 09:00 – EU Summit
Fri – Oct 19 – 09:00 – EU Summit
Charts of Interest: Tuesday and Thursday
This commentary and charts-of-interest are designed to stimulate thinking. This analysis is not a recommendation to buy, sell, hold or sell short any security (stock ETF or otherwise). We all need to think for ourselves when it comes to trading our own accounts. First, it is the only way to really learn. Second, we are the only ones responsible for our decisions. Think of these charts as food for further analysis. Before making a trade, it is important to have a plan. Plan the trade and trade the plan. Among other things, this includes setting a trigger level, a target area and a stop-loss level. It is also important to plan for three possible price movements: advance, decline or sideways. Have a plan for all three scenarios BEFORE making the trade. Consider possible holding times. And finally, look at overall market conditions and sector/industry performance.

About the author:
Arthur Hill, CMT, is the Chief Technical Strategist at TrendInvestorPro.com. Focusing predominantly on US equities and ETFs, his systematic approach of identifying trend, finding signals within the trend, and setting key price levels has made him an esteemed market technician. Arthur has written articles for numerous financial publications including Barrons and Stocks & Commodities Magazine. In addition to his Chartered Market Technician (CMT) designation, he holds an MBA from the Cass Business School at City University in London.
Learn More