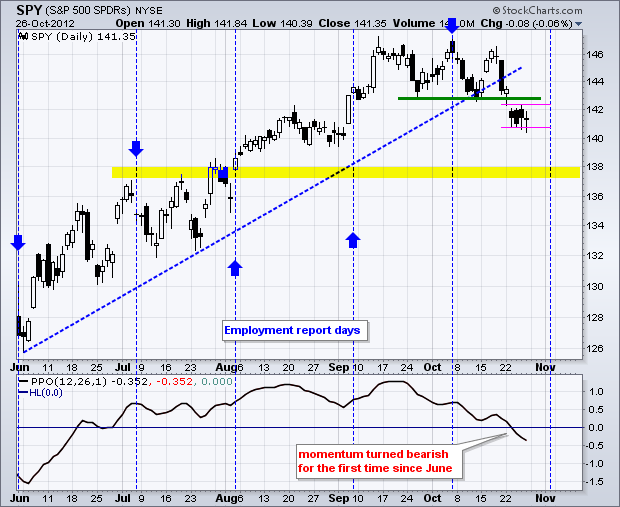
First, note that the NYSE and Nasdaq are closed on Monday because of hurricane Sandy. I am going to review some daily charts to offer a little more perspective today. After a rough start to the week, stocks managed to firm the last three days. Firmness is one thing. Buying pressure is another. Stocks firmed because buying and selling pressure moved to equilibrium. We have yet to see an uptick in buying pressure or an oversold bounce. This means stocks are simply consolidating within a downtrend. The first chart shows the S&P 500 ETF (SPY) breaking below 142 with a gap last Tuesday and then firming in the 141-142 area. At this point, the consolidation looks like a bearish continuation pattern and we could see a second shoe drop. This would target a move to the next support zone around 137-138.

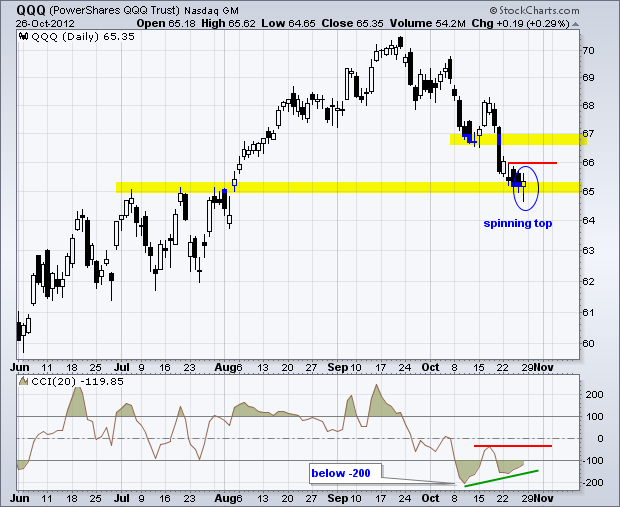
The second chart shows the Nasdaq 100 ETF (QQQ) finding some support in the 65 area with a spinning top on Friday. QQQ became quite oversold the last few weeks as the Commodity Channel Index (CCI) dipped below -200 on 10-Oct and moved back below -100 after a short bounce. A small bullish divergence formed, but we need to see a break above 66 on the price chart to signal the start of an oversold bounce.
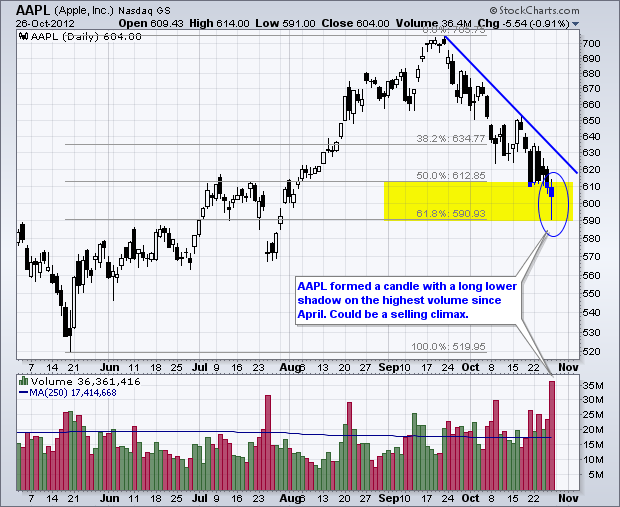
Apple is of course the key to QQQ because it accounts for around 20% of the ETF. Apple declined on the highest volume since April. Friday's candlestick looks like something between a hammer and a spinning top. A high volume decline suggests a selling climax of sorts and the candlestick shows indecision. $600 seems to have some psychological value as support and we could see an oversold bounce as traders turn their attention to the holiday season.
Before hitting the intraday charts, there are some big events to watch over the next 10 days. First, we start the week with uncertainty on the East Coast as Sandy makes landfall Monday-Tuesday. Second, it is a huge week on the economic front with several key reports (see calendar below). Third, the employment report is Friday and this is the last key economic release before the election, which is just nine days away. Just think if Sandy was just a week later.
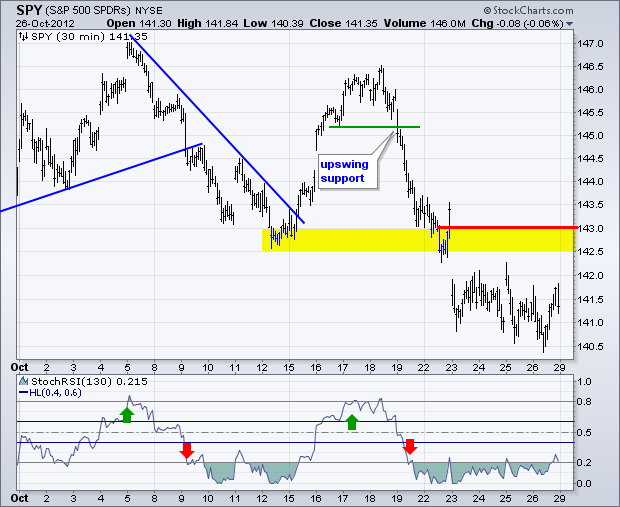
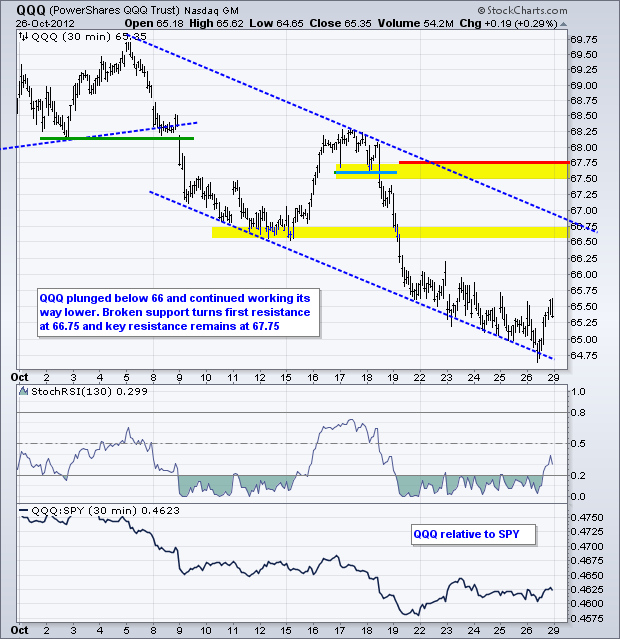
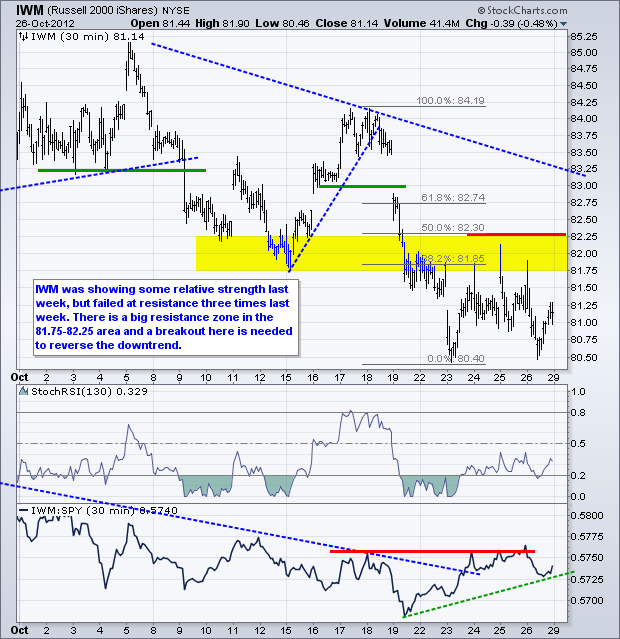
The 30-minute chart for SPY expands on the daily chart analysis. SPY broke support and broken support in the 142.5-143 area turns first resistance. Even though a consolidation breakout would be short-term positive, this could be just an oversold bounce within a bigger downtrend, which started in mid September. For now, the trend is clearly down as the consolidation shows a downward slant after the breakdown.
**************************************************************************
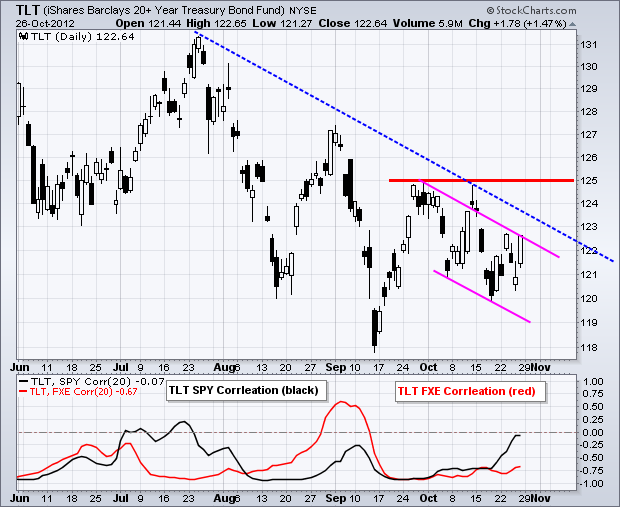
It is hard to make much sense from the 30-minute 20+ Year T-Bond ETF (TLT) chart so I am going to switch to daily for now. The trend since late July is down, but TLT formed a bullish consolidation the last four weeks. After a surge from 118 to 125, TLT pulled back with a falling flag pattern. I drew the lower trend line first and then made the upper trend line parallel. TLT is close to breaking the flag trend line to signal a continuation higher. Strong economic reports this week would be negative for TLT, while signs of weakness in the economy would be bullish. Also watch the Euro, which is negatively correlated with TLT.
**************************************************************************
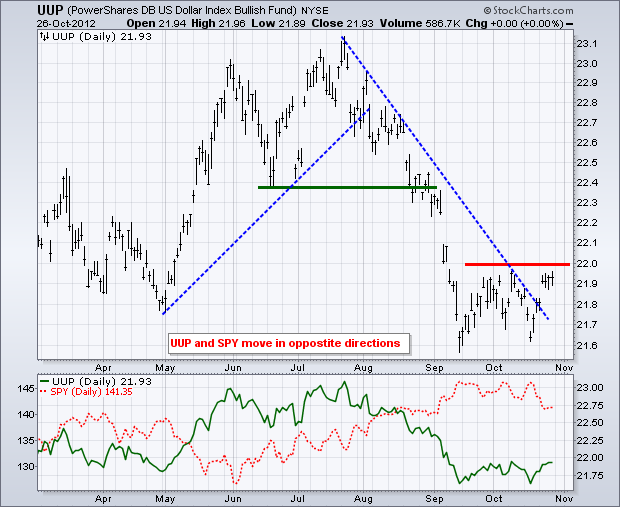
The US Dollar Fund (UUP) has been locked in a trading range since mid September, but the swing within this range is up with the surge to resistance. UUP is challenging resistance at 22 and a break above this level would be medium-term bullish. Upswing support is set at 22.80. A break below this level would suggest a failure at resistance and keep the medium-term downtrend alive.
**************************************************************************
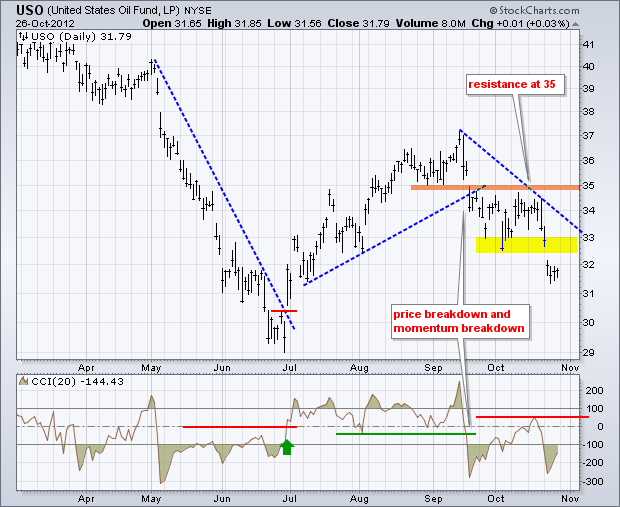
The US Oil Fund (USO) broke down in mid September and broken support turned into resistance. USO broke down further last week and then consolidated just below 32. This looks like a consolidation within a downtrend. Broken support turns first resistance in the 32.5-33 area. The next support zone is in the 29-30 area from the June low. The mid October high marks momentum resistance for CCI.
**************************************************************************
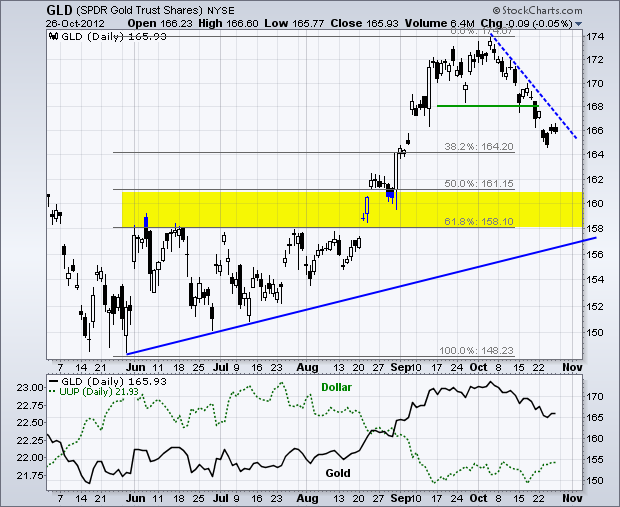
The Gold SPDR (GLD) is dependent on the Dollar and stock market. Gold is negatively correlated to the Dollar and positively correlated to the stock market. GLD fell the last three weeks with a rather orderly decline. The ETF bounced off the 38.2% retracement on Thursday and firmed around 166 on Friday. At the very least, a trend line break is needed to reverse this three week downtrend. A breakout in the Dollar would likely weigh on gold and we could then see further weakness towards the 160 area.
**************************************************************************
Key Reports and Events:
Mon - Oct 29 - 08:30 - Personal Income & Spending
Tue - Oct 30 - 09:00 - Case-Shiller 20-city Housing Index
Tue - Oct 30 - 10:00 - Consumer Confidence
Wed - Oct 31 - 07:00 - MBA Mortgage Index
Wed - Oct 31 - 08:15 - ADP Employment Report
Wed - Oct 31 - 09:45 - Chicago PMI
Wed - Oct 31 - 10:30 - Oil Inventories
Thu - Nov 01 - 07:30 - Challenger Job Report
Thu - Nov 01 - 08:30 - Jobless Claims
Thu - Nov 01 - 10:00 - ISM Manufacturing Index
Thu - Nov 01 - 10:00 - Construction Spending
Thu - Nov 01 - 14:00 - Auto/Truck Sales
Fri - Nov 02 - 08:30 - Employment Report
Fri - Nov 02 - 10:00 - Factory Orders
Tue - Nov 06 - 08:00 - Election Day
Charts of Interest: Tuesday and Thursday
This commentary and charts-of-interest are designed to stimulate thinking. This analysis is not a recommendation to buy, sell, hold or sell short any security (stock ETF or otherwise). We all need to think for ourselves when it comes to trading our own accounts. First, it is the only way to really learn. Second, we are the only ones responsible for our decisions. Think of these charts as food for further analysis. Before making a trade, it is important to have a plan. Plan the trade and trade the plan. Among other things, this includes setting a trigger level, a target area and a stop-loss level. It is also important to plan for three possible price movements: advance, decline or sideways. Have a plan for all three scenarios BEFORE making the trade. Consider possible holding times. And finally, look at overall market conditions and sector/industry performance.

Apple is of course the key to QQQ because it accounts for around 20% of the ETF. Apple declined on the highest volume since April. Friday's candlestick looks like something between a hammer and a spinning top. A high volume decline suggests a selling climax of sorts and the candlestick shows indecision. $600 seems to have some psychological value as support and we could see an oversold bounce as traders turn their attention to the holiday season.
Before hitting the intraday charts, there are some big events to watch over the next 10 days. First, we start the week with uncertainty on the East Coast as Sandy makes landfall Monday-Tuesday. Second, it is a huge week on the economic front with several key reports (see calendar below). Third, the employment report is Friday and this is the last key economic release before the election, which is just nine days away. Just think if Sandy was just a week later.

The 30-minute chart for SPY expands on the daily chart analysis. SPY broke support and broken support in the 142.5-143 area turns first resistance. Even though a consolidation breakout would be short-term positive, this could be just an oversold bounce within a bigger downtrend, which started in mid September. For now, the trend is clearly down as the consolidation shows a downward slant after the breakdown.


**************************************************************************
It is hard to make much sense from the 30-minute 20+ Year T-Bond ETF (TLT) chart so I am going to switch to daily for now. The trend since late July is down, but TLT formed a bullish consolidation the last four weeks. After a surge from 118 to 125, TLT pulled back with a falling flag pattern. I drew the lower trend line first and then made the upper trend line parallel. TLT is close to breaking the flag trend line to signal a continuation higher. Strong economic reports this week would be negative for TLT, while signs of weakness in the economy would be bullish. Also watch the Euro, which is negatively correlated with TLT.

**************************************************************************
The US Dollar Fund (UUP) has been locked in a trading range since mid September, but the swing within this range is up with the surge to resistance. UUP is challenging resistance at 22 and a break above this level would be medium-term bullish. Upswing support is set at 22.80. A break below this level would suggest a failure at resistance and keep the medium-term downtrend alive.

**************************************************************************
The US Oil Fund (USO) broke down in mid September and broken support turned into resistance. USO broke down further last week and then consolidated just below 32. This looks like a consolidation within a downtrend. Broken support turns first resistance in the 32.5-33 area. The next support zone is in the 29-30 area from the June low. The mid October high marks momentum resistance for CCI.

**************************************************************************
The Gold SPDR (GLD) is dependent on the Dollar and stock market. Gold is negatively correlated to the Dollar and positively correlated to the stock market. GLD fell the last three weeks with a rather orderly decline. The ETF bounced off the 38.2% retracement on Thursday and firmed around 166 on Friday. At the very least, a trend line break is needed to reverse this three week downtrend. A breakout in the Dollar would likely weigh on gold and we could then see further weakness towards the 160 area.

**************************************************************************
Key Reports and Events:
Mon - Oct 29 - 08:30 - Personal Income & Spending
Tue - Oct 30 - 09:00 - Case-Shiller 20-city Housing Index
Tue - Oct 30 - 10:00 - Consumer Confidence
Wed - Oct 31 - 07:00 - MBA Mortgage Index
Wed - Oct 31 - 08:15 - ADP Employment Report
Wed - Oct 31 - 09:45 - Chicago PMI
Wed - Oct 31 - 10:30 - Oil Inventories
Thu - Nov 01 - 07:30 - Challenger Job Report
Thu - Nov 01 - 08:30 - Jobless Claims
Thu - Nov 01 - 10:00 - ISM Manufacturing Index
Thu - Nov 01 - 10:00 - Construction Spending
Thu - Nov 01 - 14:00 - Auto/Truck Sales
Fri - Nov 02 - 08:30 - Employment Report
Fri - Nov 02 - 10:00 - Factory Orders
Tue - Nov 06 - 08:00 - Election Day
Charts of Interest: Tuesday and Thursday
This commentary and charts-of-interest are designed to stimulate thinking. This analysis is not a recommendation to buy, sell, hold or sell short any security (stock ETF or otherwise). We all need to think for ourselves when it comes to trading our own accounts. First, it is the only way to really learn. Second, we are the only ones responsible for our decisions. Think of these charts as food for further analysis. Before making a trade, it is important to have a plan. Plan the trade and trade the plan. Among other things, this includes setting a trigger level, a target area and a stop-loss level. It is also important to plan for three possible price movements: advance, decline or sideways. Have a plan for all three scenarios BEFORE making the trade. Consider possible holding times. And finally, look at overall market conditions and sector/industry performance.

About the author:
Arthur Hill, CMT, is the Chief Technical Strategist at TrendInvestorPro.com. Focusing predominantly on US equities and ETFs, his systematic approach of identifying trend, finding signals within the trend, and setting key price levels has made him an esteemed market technician. Arthur has written articles for numerous financial publications including Barrons and Stocks & Commodities Magazine. In addition to his Chartered Market Technician (CMT) designation, he holds an MBA from the Cass Business School at City University in London.
Learn More