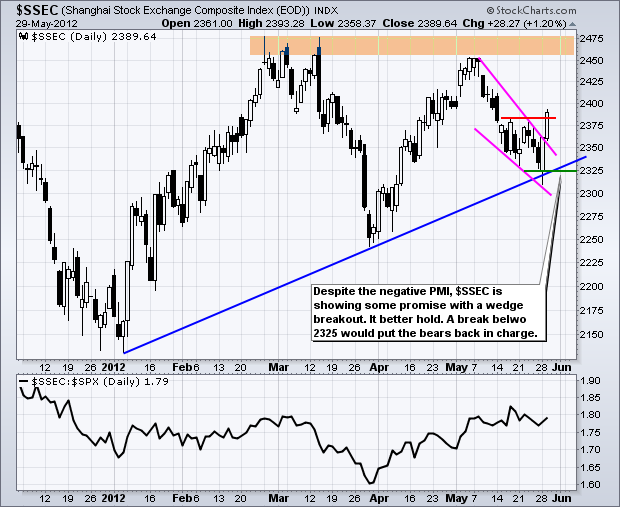
June is shaping up to be one critical month. Worse-than-expected economic reports this week would solidify the medium-term downtrends in the major index ETFs. Another Euro crisis after the Greek elections could keep buyers at bay even longer. A slight majority of US economic reports have been worse-than-expected the last 6-8 weeks and it is clear that European leaders are well behind the curve. Elsewhere, the Chinese Flash PMI was 48.7 and the Eurozone PMI was 45.90, both of which suggest economic contraction. In short, the major index ETFs are in medium-term downtrends and the negative news flow is backing up these trends.
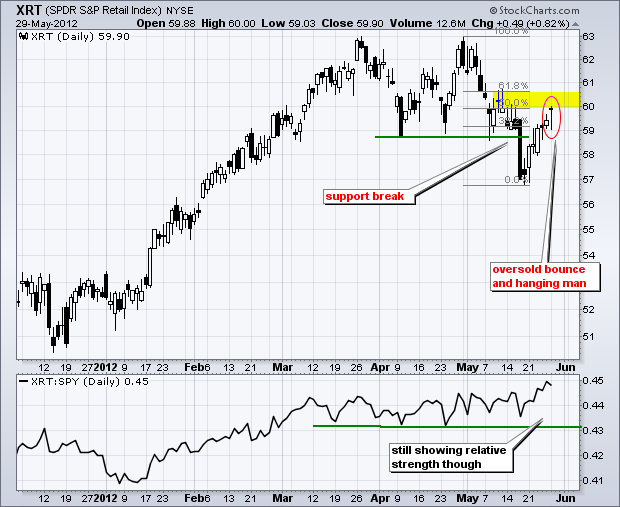
The Conference Board reported that its Consumer Confidence Index declined to 64.9, which is down from its February high of 71.60. Expectations were for 70 and this sub-65 reading was much worse-than-expected. A decline in consumer confidence could translate into a drop in retail sales. The news out of Europe is not good and we have a big employment report due this week. News is shifting somewhat from the Euro area to the US economy this week so I will be watching key groups like the Retail SPDR (XRT).
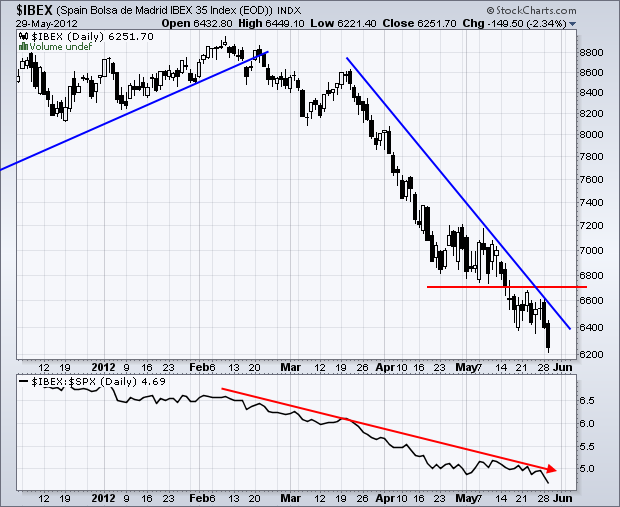
And then there is Spain. The Spain Bolsa de Madrid IBEX 35 Index ($IBEX) sank over 2% on Monday and hit another 52-week low. The index is down another 1.55% in early trading on Wednesday. Spanish bond yields are moving higher and the bond vigilantes are making it more expensive for Spanish finances. Needless to say, the spread between Spanish Bonds and German Bunds is at its highest level since the birth of the Euro. Spain has a real estate crisis, a banking crisis, a stalled economy, a potential sovereign debt crisis and a high level of unemployment. To make matters worse, Spain is much bigger than Greece and probably too big to bail out. The ECB insists that bank bailouts are the responsibility of the Spanish government, but the Spanish finance minister is dragging his feet. It seems that Spain, like Greece, expects more from the EU, but the EU expects more from Spain. Something needs to give or else....
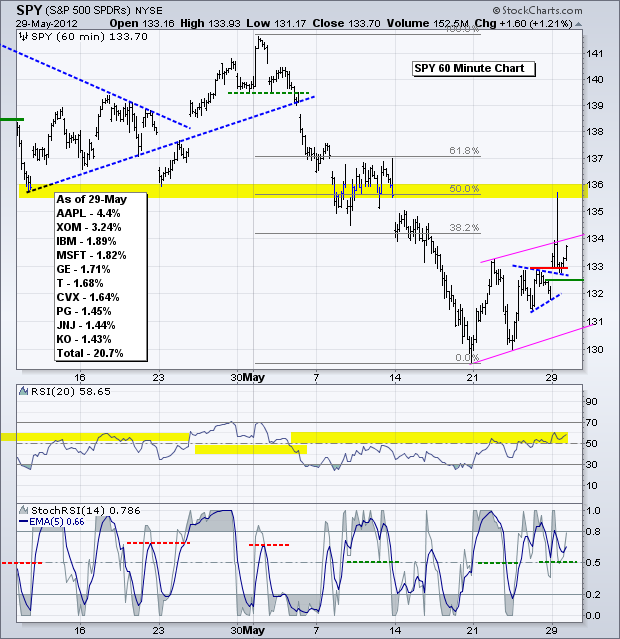
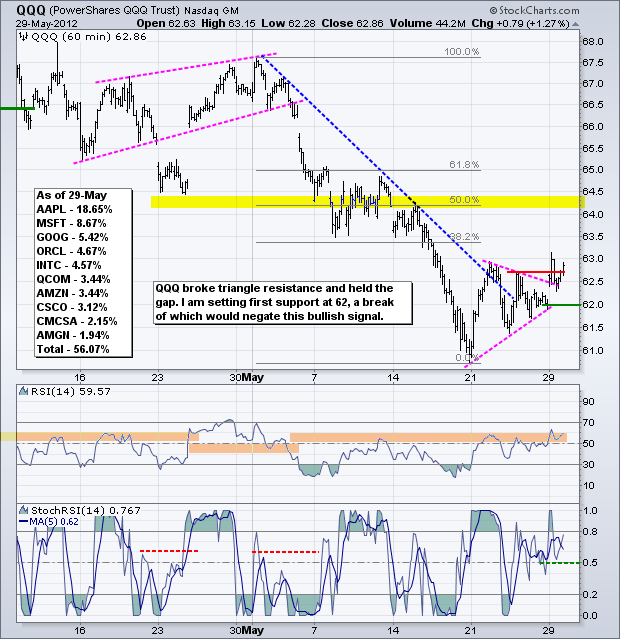
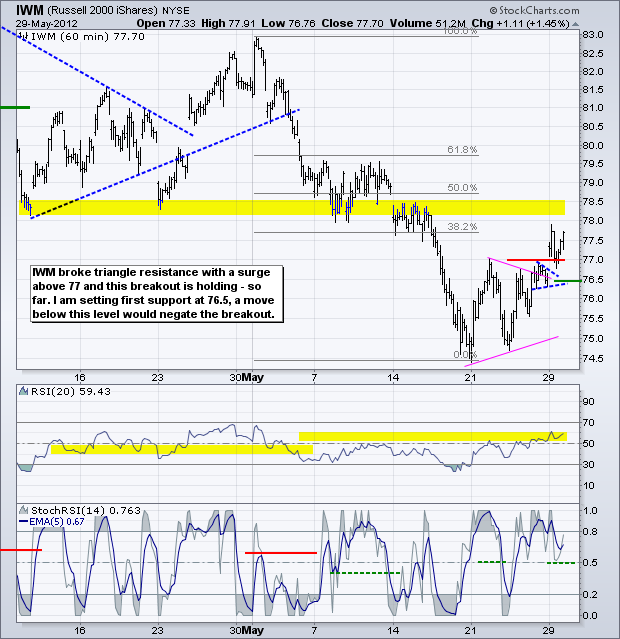
On the 60-minute chart, the S&P 500 ETF (SPY) broke triangle resistance and held the breakout, even after a brief dip below 133. The concern now is that a rising flag is taking shape the last six trading days (pink lines). These are bearish continuation patterns. A move below 132.5 would negate the breakout and increase the chances of the bear flag. A break below the flag trendline would signal a continuation of the May decline and target further weakness below 130. RSI failed to confirm the breakout because it did not exceed 60. The 5-day EMA of StochRSI is fluctuating above the .50 level. A break below this level would provide the first sign that momentum is swinging back to the bears.
**************************************************************************
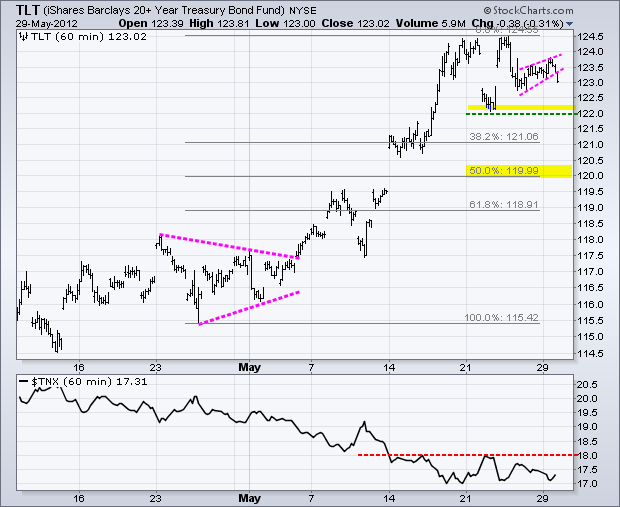
The 20+ Year T-Bond ETF (TLT) broke rising wedge support, but this break occurred with a bigger trading range (122-124.5) and a bigger uptrend (since mid March). Treasuries held up because the Euro remained weak and Spanish equities crumbled. There is still demand for this key risk-off asset. Tuesday's breakouts in SPY, QQQ and IWM are questionable as long as TLT remains strong (above support at 122).
**************************************************************************
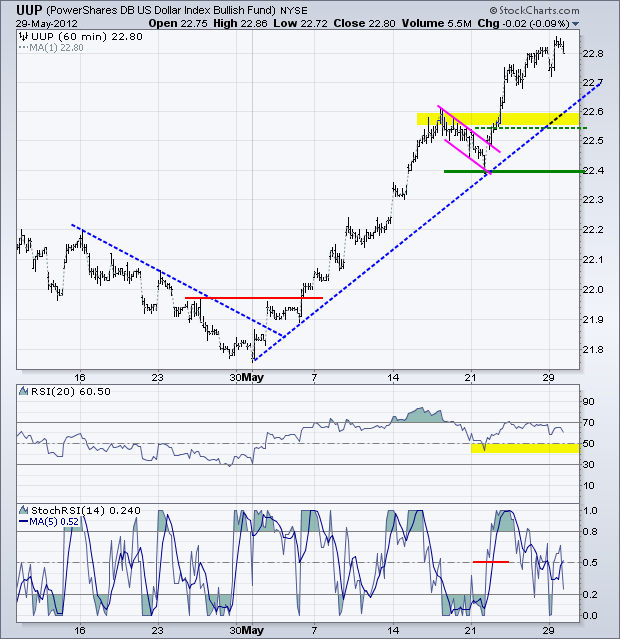
The US Dollar Fund (UUP) started weak, but quickly rebounded as money moved out of the Euro. UUP remains overbought and the Euro remains oversold, but Forex traders are not buying Euros with so much uncertainty on the horizon (Greece, Portugal and Spain). Broken resistance remains first support in the 22.55-22.6 area and key support remains at 22.40.
**************************************************************************
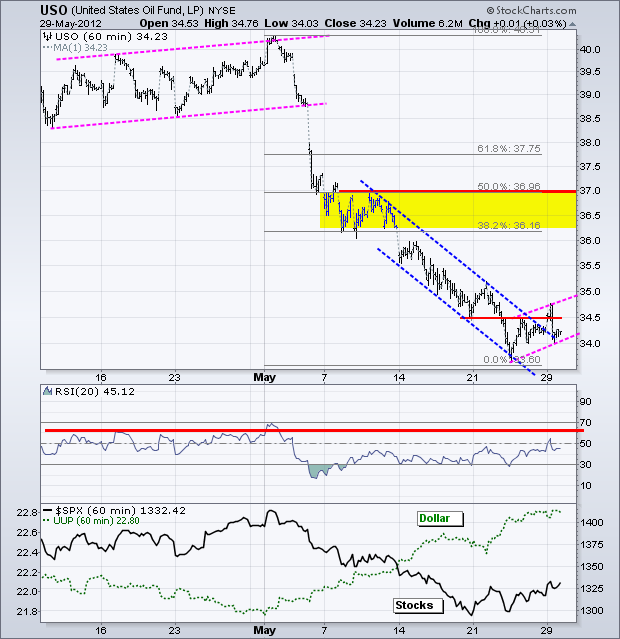
Oil started its oversold bounce, but quickly fell back as the Dollar strengthened. The strong Dollar remains an Achilles heel for commodities. On the price chart, the US Oil Fund (USO) edged higher the last few days and a rising flag could be taking shape. A break below 34 would signal yet another continuation lower.
**************************************************************************
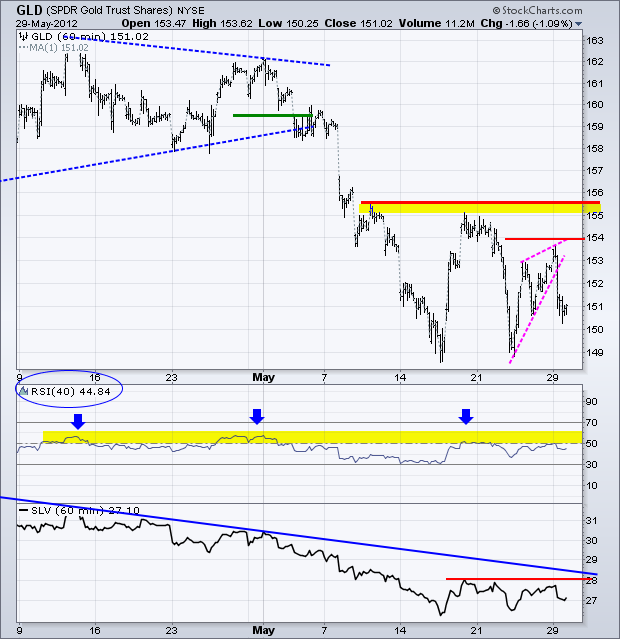
Gold started the day strong, but selling pressure took hold as the Dollar surged. While the Gold SPDR (GLD) has support in the 149-150 area, the bigger trend remains down as long as key resistance at 155.50 holds. In addition, 40-period RSI remains in bear mode as long as it trades below 60, a level that has held since late March. With the sharp decline GLD broke rising wedge support and established a lower resistance at 154 that can be watched for an earlier breakout signal.
**************************************************************************
Key Economic Reports:
Wed - May 30 - 07:00 - MBA Mortgage Index
Wed - May 30 - 10:00 - Pending Home Sales
Thu - May 31 - 07:30 - Challenger Job Cut Report
Thu - May 31 - 08:15 - ADP Employment Report
Thu - May 31 - 08:30 - Jobless Claims
Thu - May 31 - 08:30 - GDP
Thu - May 31 - 09:45 - Chicago PMI
Thu - May 31 - 11:00 - Oil Inventories
Fri - Jun 01 - 08:30 - Employment Report
Fri - Jun 01 - 10:00 - ISM Manufacturing Index
Fri - Jun 01 - 10:00 - Construction Spending
Fri - Jun 01 - 14:00 - Auto/Truck Sales
Sun - Jun 04 - 10:00 – Greek Holiday
Sun - Jun 17 - 10:00 – Greek Elections
Sun - Jun 28 - 10:00 – 2-day EU Summit
Charts of Interest: Tuesday and Thursday
This commentary and charts-of-interest are designed to stimulate thinking. This analysis is not a recommendation to buy, sell, hold or sell short any security (stock ETF or otherwise). We all need to think for ourselves when it comes to trading our own accounts. First, it is the only way to really learn. Second, we are the only ones responsible for our decisions. Think of these charts as food for further analysis. Before making a trade, it is important to have a plan. Plan the trade and trade the plan. Among other things, this includes setting a trigger level, a target area and a stop-loss level. It is also important to plan for three possible price movements: advance, decline or sideways. Have a plan for all three scenarios BEFORE making the trade. Consider possible holding times. And finally, look at overall market conditions and sector/industry performance.

About the author:
Arthur Hill, CMT, is the Chief Technical Strategist at TrendInvestorPro.com. Focusing predominantly on US equities and ETFs, his systematic approach of identifying trend, finding signals within the trend, and setting key price levels has made him an esteemed market technician. Arthur has written articles for numerous financial publications including Barrons and Stocks & Commodities Magazine. In addition to his Chartered Market Technician (CMT) designation, he holds an MBA from the Cass Business School at City University in London.
Learn More
