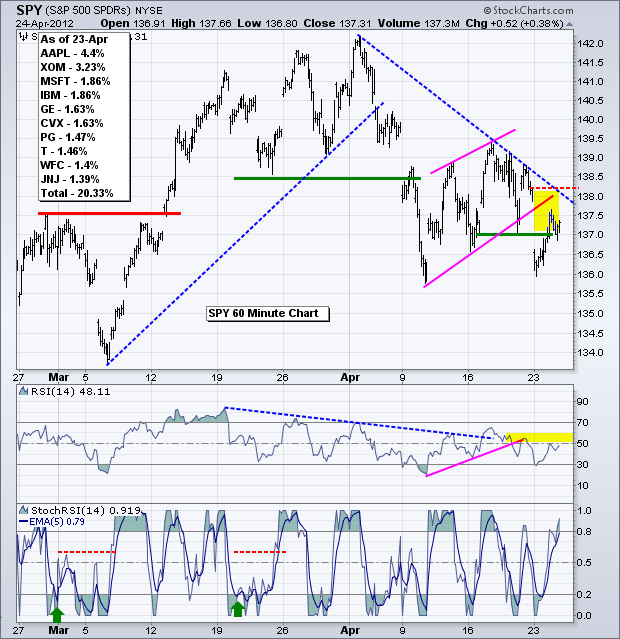
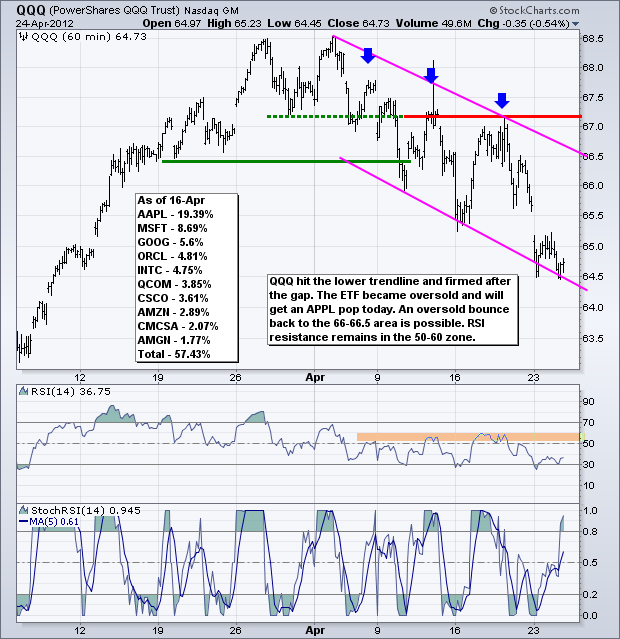
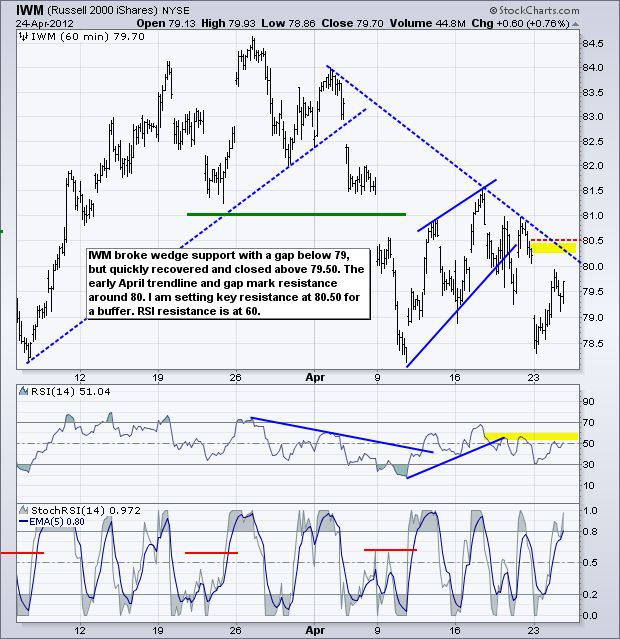
Apple is stoking the street with a big move after reporting earnings. While a strong open is expected, what happens after the open, and after the Fed statement, is more important. Actually, I think Thursday's price action will hold the key to the next move in stocks. Trading is likely to remain choppy and news driven today. Thursday is when the dust will settle. On the price chart, the S&P 500 ETF (SPY) broke rising wedge support with a gap below 137, but moved higher almost immediately after the gap and is currently in the gap zone. Apple and Fed expectations may have limited selling pressure and kept buoyed the bulls. The trendline extending down from early April and the top of the gap zone mark resistance in the 138 area. While a break above 138.15 would be short-term bullish, volatility could keep the market in check today. RSI resistance remains in the 50-60 zone and a break above 60 would turn short-term momentum bullish.
**************************************************************************
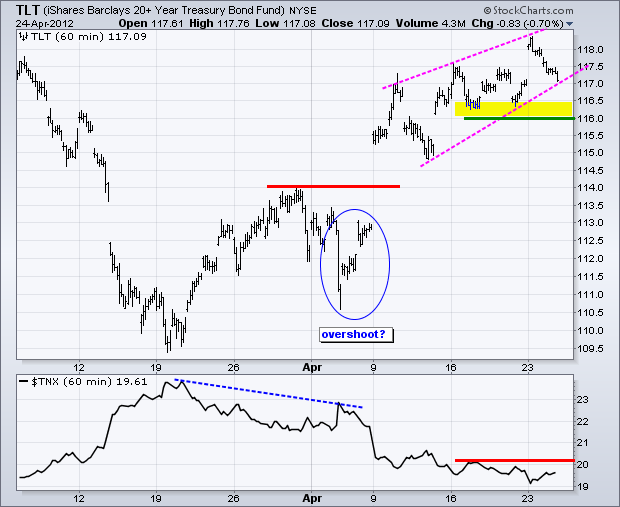
The 20+ Year T-Bond ETF (TLT) surged above resistance with a big move on April 9th and then zigzagged higher. A rising wedge has taken shape with support in the 116-116.50 area. Treasuries will be in the spot light with the Fed policy statement today. Dovish comments on monetary policy and talk of weak employment numbers would likely boost treasuries. Conversely, anything hawkish or employment positive would be negative for treasuries.
**************************************************************************
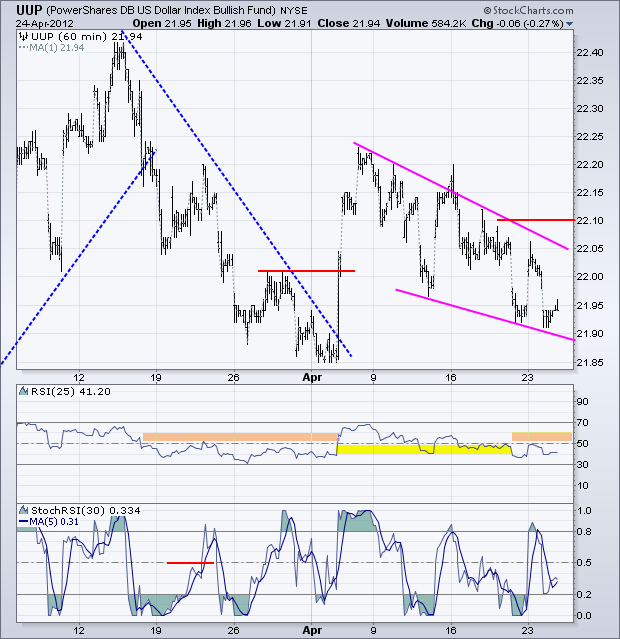
The US Dollar Fund (UUP) bounced above 22 briefly, but quickly fell back and forged another lower low. Overall, the ETF remains within a falling wedge pattern that defines the short-term downtrend. Key resistance is set at 22.10 and a breakout here is needed to reverse the downtrend. The Dollar will also be waiting on the Fed. Any hint of tighter monetary policy and an improving economy would be Dollar bullish, while talk of QE3 and a weakening job market would be Dollar bearish.
**************************************************************************
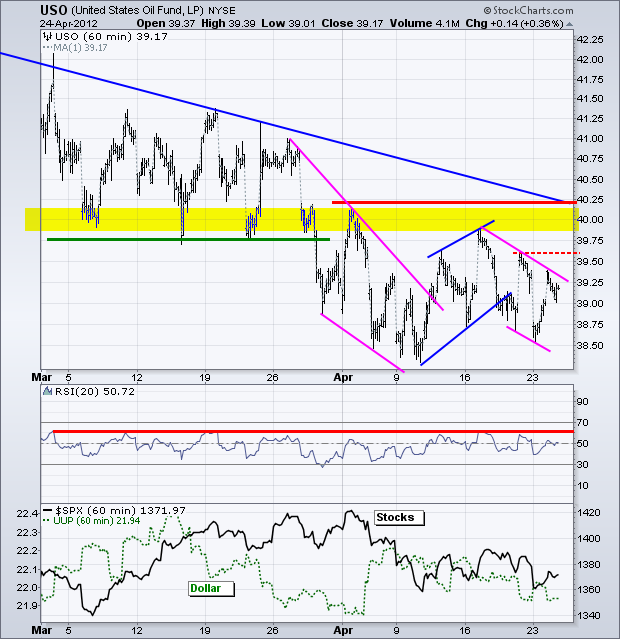
No change. It is a battle of the wedges on the US Oil Fund (USO) chart. The ETF remains in a bigger downtrend after the support break in late March. USO also formed a series of wedges the last four weeks (falling, rising and falling). The most recent wedge or channel is falling with first resistance marked at Friday's high (39.61). A move above this level would reverse the four day downswing and set up another resistance challenge.
**************************************************************************
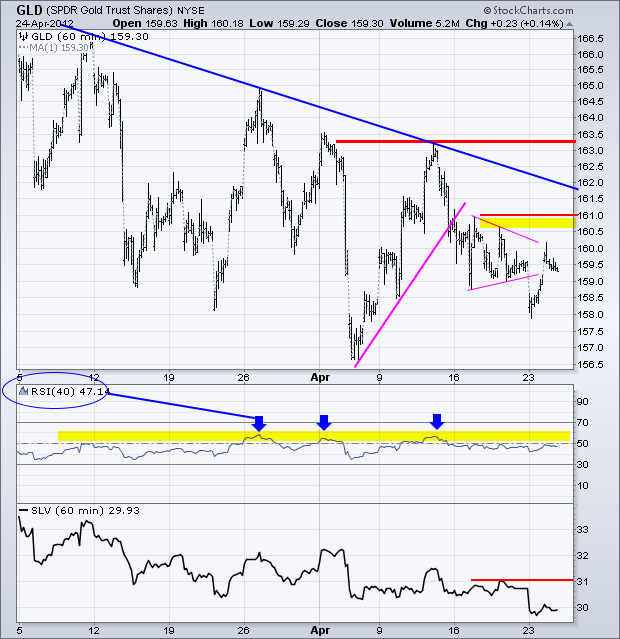
No change. The Gold SPDR (GLD) broke pennant support with a weak open and then rebounded with a move back above 159. There are two downtrends present on this chart. First, GLD has been zigzagging lower since late February. Second, GLD broke upswing support with a decline on April 13th to start a downswing. The pennant highs mark first resistance in the 160.5-161 area. RSI resistance remains at 60. A break above both these levels is needed before thinking bull on bullion.
**************************************************************************
Key Economic Reports:
Wed - Apr 25 - 08:30 – Durable Goods Orders
Wed - Apr 25 - 10:30 - Oil Inventories
Wed - Apr 25 - 12:30 – FOMC Policy Statement
Thu - Apr 26 - 08:30 - Jobless Claims
Thu - Apr 26 - 10:00 – Pending Home Sales
Fri - Apr 27 - 10:00 - GDP
Fri - Apr 27 - 09:55 – Michigan Sentiment
Charts of Interest: Tuesday and Thursday in separate post.
This commentary and charts-of-interest are designed to stimulate thinking. This analysis is not a recommendation to buy, sell, hold or sell short any security (stock ETF or otherwise). We all need to think for ourselves when it comes to trading our own accounts. First, it is the only way to really learn. Second, we are the only ones responsible for our decisions. Think of these charts as food for further analysis. Before making a trade, it is important to have a plan. Plan the trade and trade the plan. Among other things, this includes setting a trigger level, a target area and a stop-loss level. It is also important to plan for three possible price movements: advance, decline or sideways. Have a plan for all three scenarios BEFORE making the trade. Consider possible holding times. And finally, look at overall market conditions and sector/industry performance.

