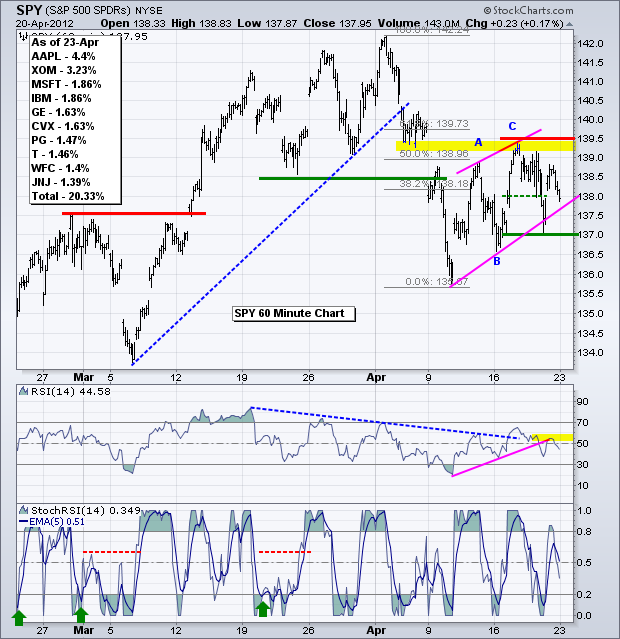
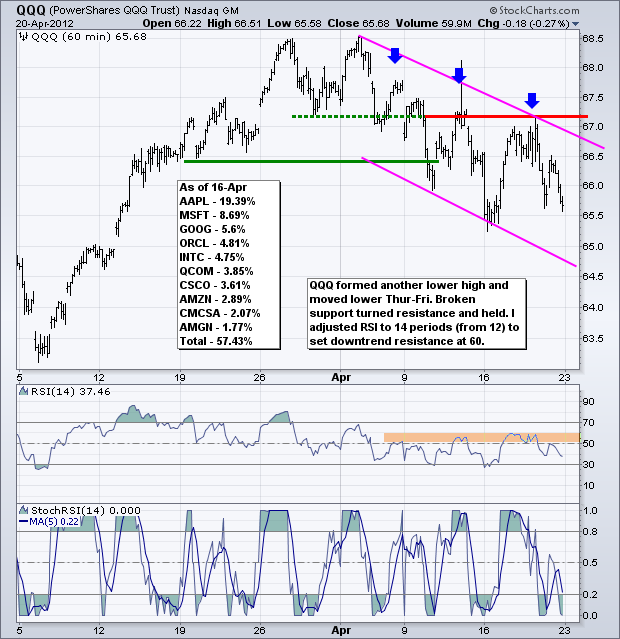
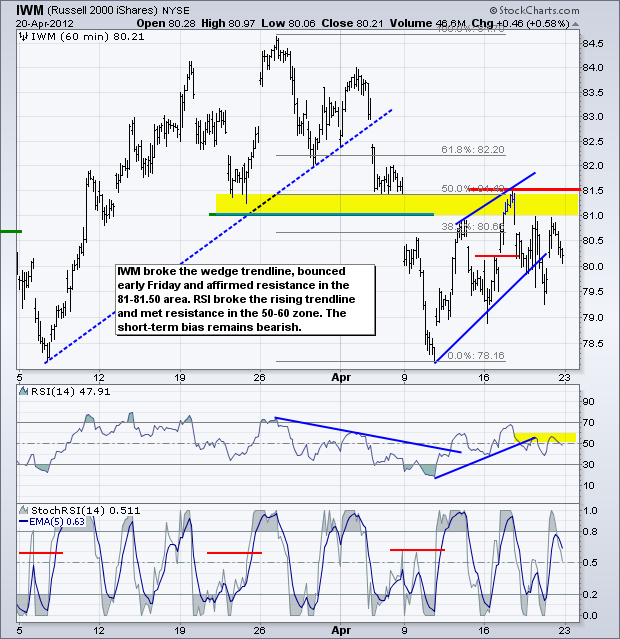
Stocks look heavy as selling pressure hit Friday afternoon and remains early Monday. $SPX futures are down around 10 points in early trading (5AM ET). Bonds and the Dollar are up, while gold and oil are down. Stocks surged last Tuesday, but gave back these gains with a decline on Thursday. There was another surge on Friday morning, but stocks failed to follow through and dipped in the afternoon for a weak close. While there has not been a noticeable increase in selling pressure, it seems that buying pressure has dried up and the market may be falling under its own weight. On the SPY chart, the ETF broke support with a sharp decline in early April and then rebounded with a rising wedge. This wedge retraced 50-61.80% of the prior decline and formed an ABC corrective pattern, both of which are typical for bounces within bigger downtrends. The rising wedge trendline is holding so far and I am marking key support at 137. A move below this level would reverse the eight day uptrend and call for a continuation of the early April decline. The March low marks next support in the 134 area. In the indicator window, RSI triggered a bearish signal with a break below the rising trendline and dip below 40. The indicator met resistance in the 50-60 zone late last week and remains in bear mode for now.
**************************************************************************
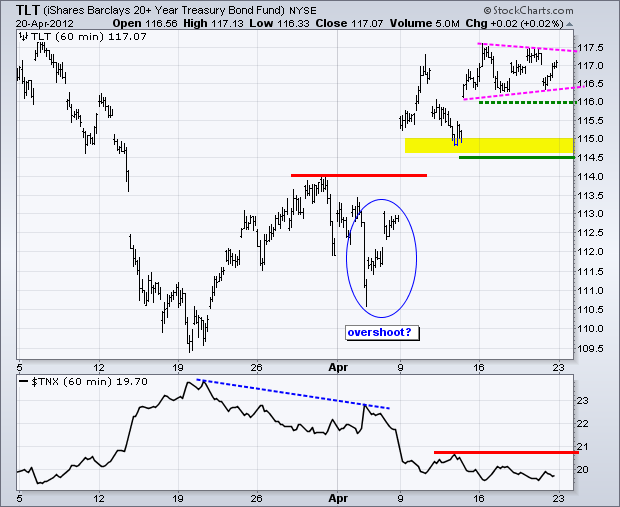
The Fed starts its meeting on Tuesday and makes its policy statement on Wednesday (12:30). To QE3 or not to QE3? That is the question that will keep the treasury market on pins and needles. It really depends on what happens with the employment report in early May. Weak job growth or worse-than-expected non-farm payrolls would increase the chances of QE3 and keep the bid in treasuries. On the price chart, the 20+ Year T-Bond ETF (TLT) remains in an uptrend with a pennant consolidation forming last week. A break above 117.50 would signal a continuation higher. First support remains at 116 and key support is at 114.50.
**************************************************************************
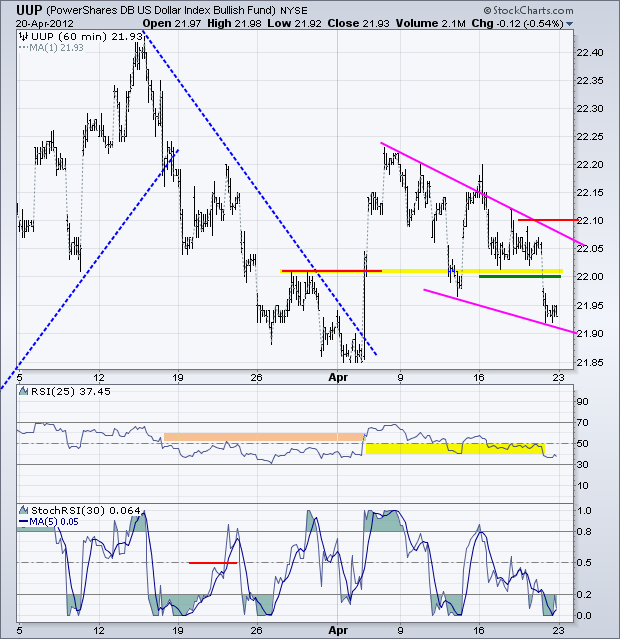
The US Dollar Fund (UUP) broke support with a sharp decline on Friday. It seems that the Dollar overshoots on the way up and on the way down. Perhaps this support break is an overshoot to flush out the weak hands. The two week trend is down, but looks like a falling wedge. With a bounce expected today, a higher low could form in the 21.92 area. A move above 22.10 is needed to reverse the falling wedge though.
**************************************************************************
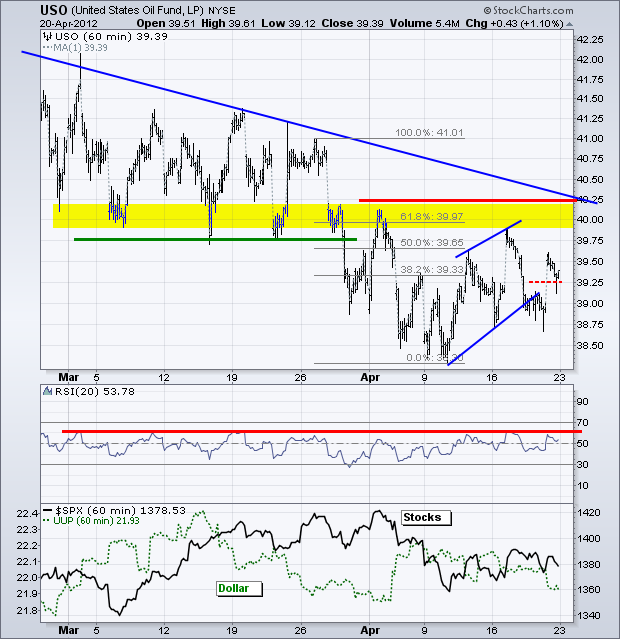
The US Oil Fund (USO) surged early Friday, but remains below key resistance in the 40 area and in a downtrend overall. I do not see oil moving higher if stocks weaken and the Dollar bounces. Overall, USO formed a rising wedge and broke the wedge trendline. Even though oil recovered on Friday, I think the overall downtrend rules here. Look for a break above last week's high and an RSI break above 65 for a reversal.
**************************************************************************
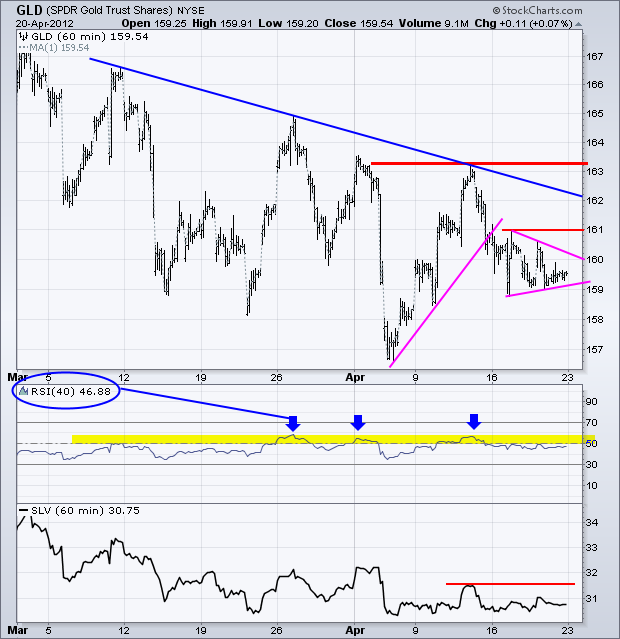
As with oil, the Gold SPDR (GLD) remains in a downtrend with a series of lower lows and lower highs since early March. I set RSI at 40 periods so the momentum oscillator would peak in the 50-60 zone with each lower high. This resistance zone defines the current downtrend in momentum. On the price chart, GLD broke upswing support on 13-Apr and then consolidated last week. This consolidation looks like a pennant and a break below 159 would signal a continuation of the downtrend. I am setting first resistance at 161 and a break above this level would be the first bullish sign.
**************************************************************************
Key Economic Reports:
Tue - Apr 24 - 08:30 – FOMC Meeting Begins
Tue - Apr 24 - 09:00 – Case-Shiller Housing Index
Tue - Apr 24 - 10:00 – Consumer Confidence
Tue - Apr 24 - 10:00 – New Home Sales
Wed - Apr 25 - 08:30 – Durable Goods Orders
Wed - Apr 25 - 10:30 - Oil Inventories
Wed - Apr 25 - 12:30 – FOMC Policy Statement
Thu - Apr 26 - 08:30 - Jobless Claims
Thu - Apr 26 - 10:00 – Pending Home Sales
Fri - Apr 27 - 10:00 - GDP
Fri - Apr 27 - 09:55 – Michigan Sentiment
Charts of Interest: Tuesday and Thursday in separate post.
This commentary and charts-of-interest are designed to stimulate thinking. This analysis is not a recommendation to buy, sell, hold or sell short any security (stock ETF or otherwise). We all need to think for ourselves when it comes to trading our own accounts. First, it is the only way to really learn. Second, we are the only ones responsible for our decisions. Think of these charts as food for further analysis. Before making a trade, it is important to have a plan. Plan the trade and trade the plan. Among other things, this includes setting a trigger level, a target area and a stop-loss level. It is also important to plan for three possible price movements: advance, decline or sideways. Have a plan for all three scenarios BEFORE making the trade. Consider possible holding times. And finally, look at overall market conditions and sector/industry performance.

