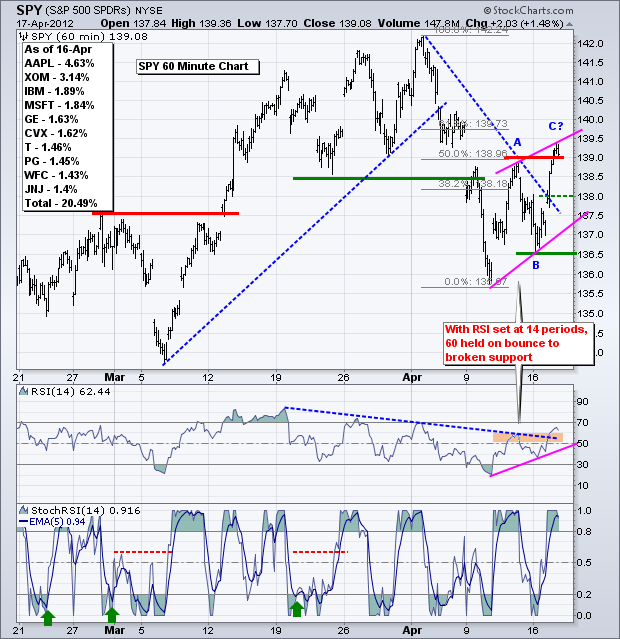
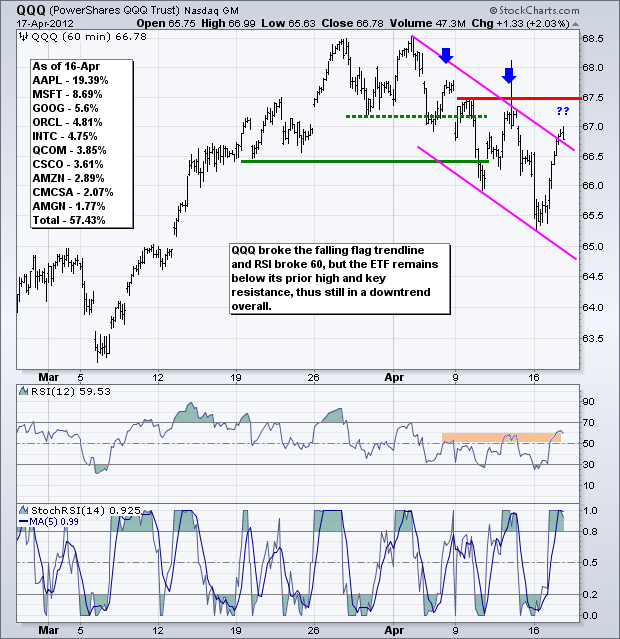
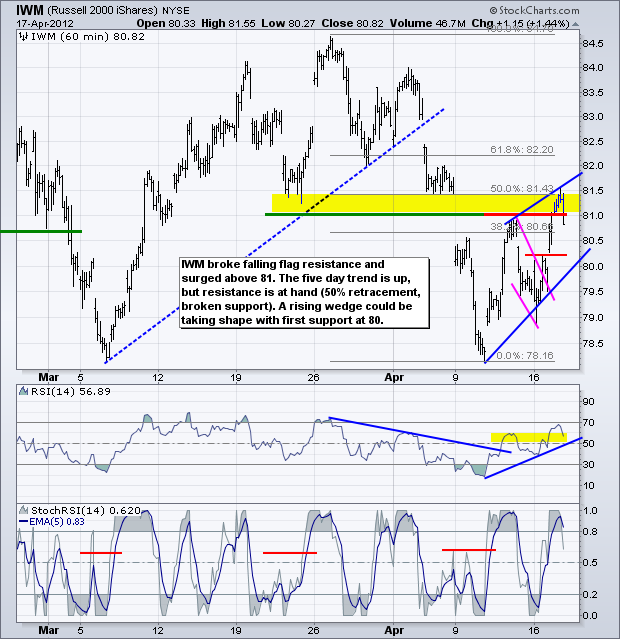
Stocks surged with the oversold Nasdaq 100 ETF (QQQ) leading the major index ETFs higher on Tuesday. What is it about Tuesdays and turnarounds? All sectors were up with technology, industrials and energy leading the charge. IWM and SPY have five day uptrends working on the 60-minute charts, but these advances could turn into rising wedges and peak near key retracements. QQQ remains in a downtrend because it has yet to exceed last Thursday's high. On the 60-minute chart, SPY broke support at 138.5 with a gap down and became oversold with the dip below 136 last week. The bounce back above 139 retraced 50-61.80% of the prior decline and formed a possible ABC pattern. The pattern and retracement are typical for bounces within bigger downtrends. Also note that broken supports and the gap around 139 could offer resistance. A move below the trendline breakout at 138 would be the first sign of a bearish reversal. In the indicator window, RSI broke above 60 and is trending up. A break below 40 would turn this momentum oscillator bearish again. Trading could remain choppy because we are in the middle of earnings season.
**************************************************************************
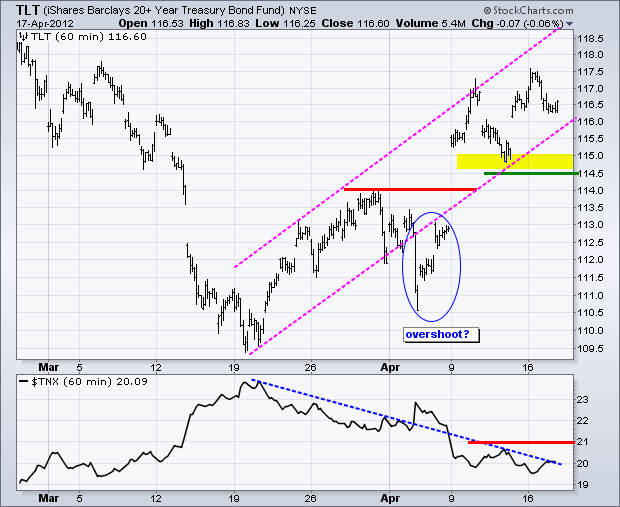
Treasuries pulled back as the stock market bounced, but the overall trend remains up. Do treasuries smell QE3? The 20+ Year T-Bond ETF (TLT) remains in an uptrend defined by the rising channel and key support in the 114.5-115 area. The 10-year Treasury Yield ($TNX) remains in a downtrend with key resistance at 21 (2.1%).
**************************************************************************
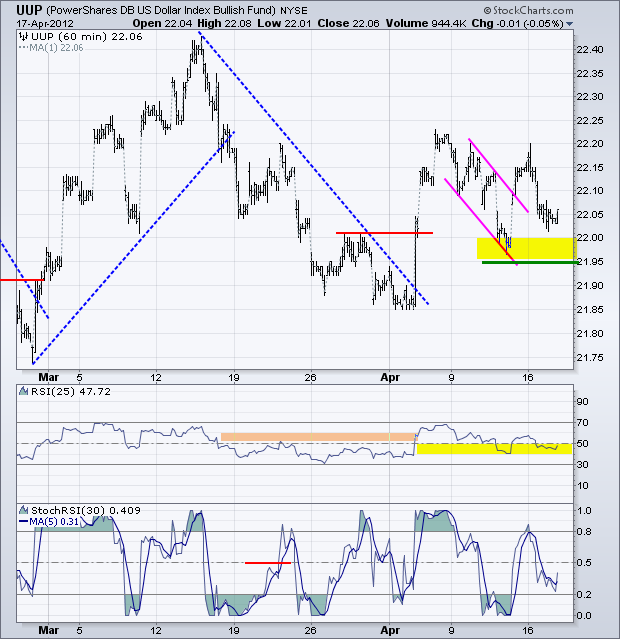
No change. The US Dollar Fund (UUP) fell back after its flag breakout, but remains above support in the 21.95-22 area. For now the flag breakout is holding and key support remains at 21.95. RSI support is set at 40.
**************************************************************************
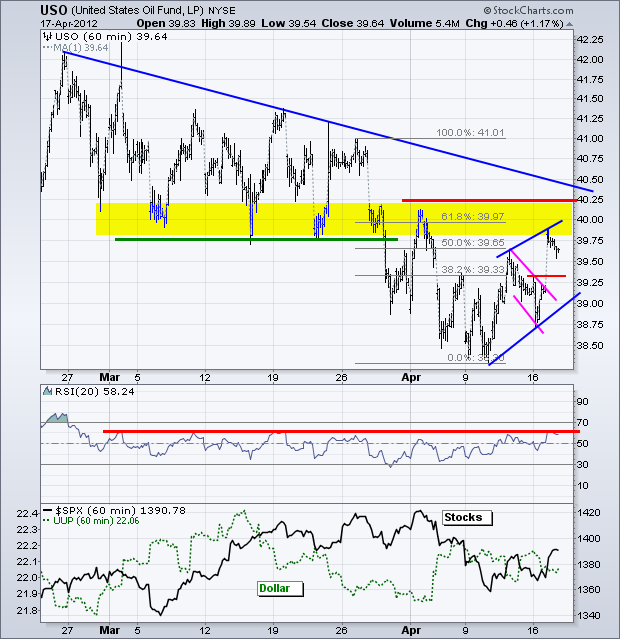
The US Oil Fund (USO) remains in a downtrend since late February, but the ETF broke flag resistance with a surge above 39.50 early Tuesday. This puts the ETF right near a resistance zone from broken support in the 39.75-40 area. As with SPY and IWM above, it is possible that a rising wedge is taking shape as the ETF trades in the 50-61.80% retracement zone. RSI is also hitting resistance at 65.
**************************************************************************
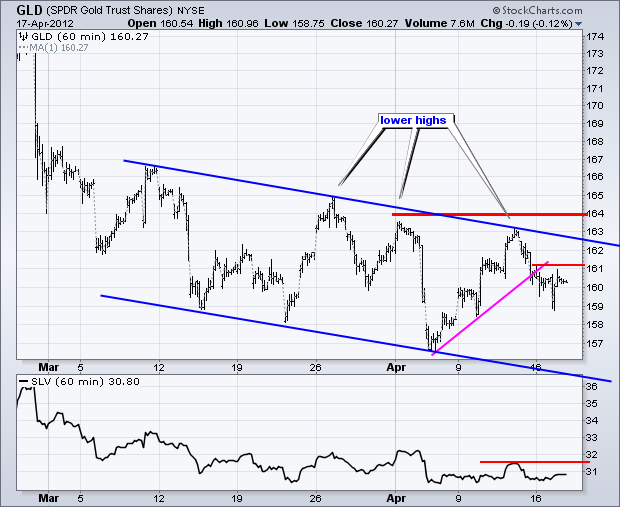
After a sharp decline in late February and early March, the decline in the Gold SPDR (GLD) slowed as the ETF zigzagged lower the last 5-6 weeks. A series of lower lows and lower highs has taken shape as the ETF oscillates around the 160-161 level. The most recent signal was the trendline break on Friday. The ETF continued below 160 Monday-Tuesday, but showed some resilience with a close above 160 on Tuesday. Follow through is needed before thinking bull though. First resistance is set just above 161 and key resistance at 164.
**************************************************************************
Key Economic Reports:
Wed - Apr 18 - 07:00 - MBA Mortgage Index
Wed - Apr 18 - 10:30 - Crude Inventories
Thu - Apr 19 - 08:30 - Initial Claims
Thu - Apr 19 - 10:00 - Existing Home Sales
Thu - Apr 19 - 10:00 - Philadelphia Fed
Thu - Apr 19 - 10:00 - Leading Indicators
Charts of Interest: Tuesday and Thursday in separate post.
This commentary and charts-of-interest are designed to stimulate thinking. This analysis is not a recommendation to buy, sell, hold or sell short any security (stock ETF or otherwise). We all need to think for ourselves when it comes to trading our own accounts. First, it is the only way to really learn. Second, we are the only ones responsible for our decisions. Think of these charts as food for further analysis. Before making a trade, it is important to have a plan. Plan the trade and trade the plan. Among other things, this includes setting a trigger level, a target area and a stop-loss level. It is also important to plan for three possible price movements: advance, decline or sideways. Have a plan for all three scenarios BEFORE making the trade. Consider possible holding times. And finally, look at overall market conditions and sector/industry performance.

