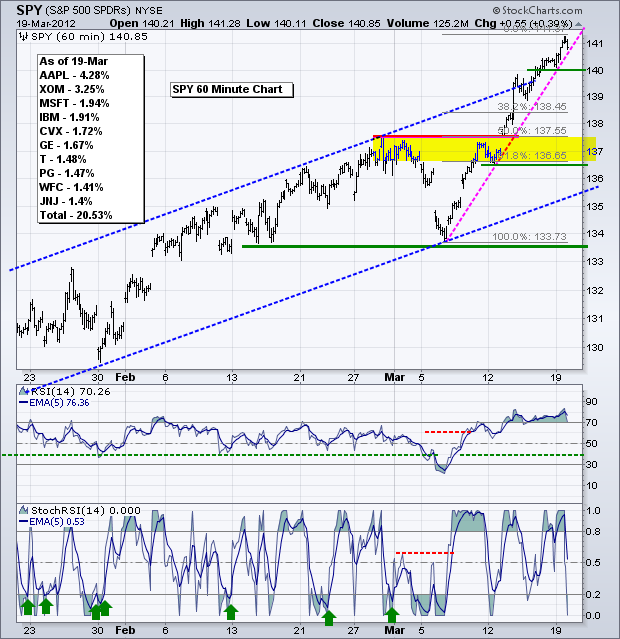
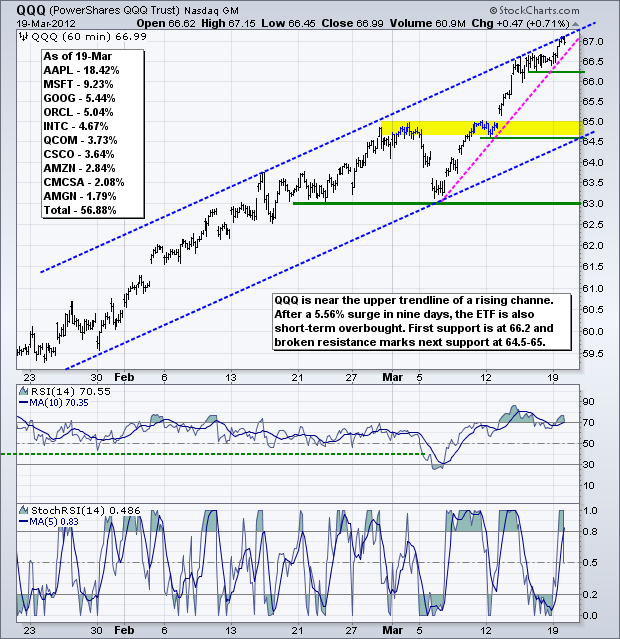
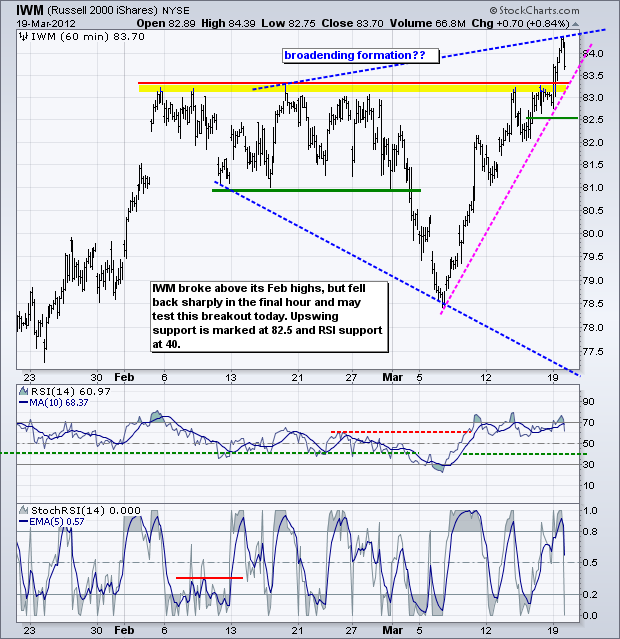
The song remains the same (circa 1973). Stocks are overbought, but there are simply no signs of significant selling pressure. Maybe that will change with stock futures down in early trading on turnaround Tuesday. Over the last nine days, the S&P 500 ETF (SPY) is up 4.98%, the Nasdaq 100 ETF (QQQ) is up 5.56% and the Russell 2000 ETF (IWM) is up 6.3%. In a reversal of fortune this month, small-caps are leading the way over the last nine days. Sector-wise, the Finance SPDR (XLF) led the charge by gaining almost 10% in just nine days. The Technology SPDR (XLK) and the Industrials SPDR (XLI) are up over 5%, while the Consumer Discretionary SPDR (XLY) is up 4.4%. It has been a broad based rally all sector SPDRs, except the Utilities SPDR (XLU), moving higher. Needless to say, the defensive sectors had a hard time the last two weeks. At this point, the odds of a correction or pullback remain high. On the 60-minute chart, SPY remains with a nine-day upswing within a thirteen-week uptrend. Both the nine-day upswing and thirteen-week uptrend are overextended. In fact, conditions rarely get this overbought. First support is marked at 140, a break of which could lead to a deeper pullback towards the next support zone in the 137 area.
**************************************************************************
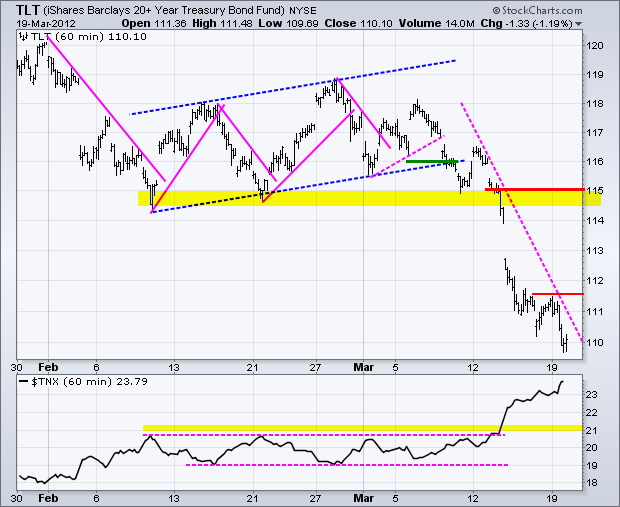
The 20+ Year T-Bond ETF (TLT) remains as oversold as the stock market is overbought. The ETF is down 6.4% the last nine days, which reflects the market's sudden shift on Fed expectations. The treasury market now expects the Fed to raise rates or tighten policy in 2013. With a bounce on Friday, TLT established first resistance at 111.60. A break above this level would argue for an oversold bounce, but I am not sure how far it will extend. A lot will depend on the stock market, and perhaps the Euro.
**************************************************************************
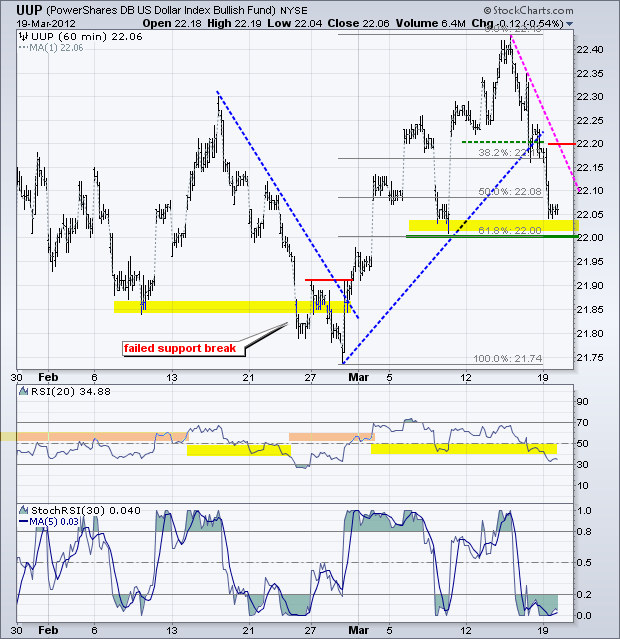
The US Dollar Fund (UUP) fell further on Monday and has now retraced 61.80% of the prior surge. I still think the bigger trend is up for the Dollar and down for the Euro. Moreover, I think Fed policy is likely to be "less loose" than European Central Bank policy in the coming months. These assumptions, if correct, suggest that UUP should bounce sooner rather than later. Downswing resistance is set at 22.20.
**************************************************************************
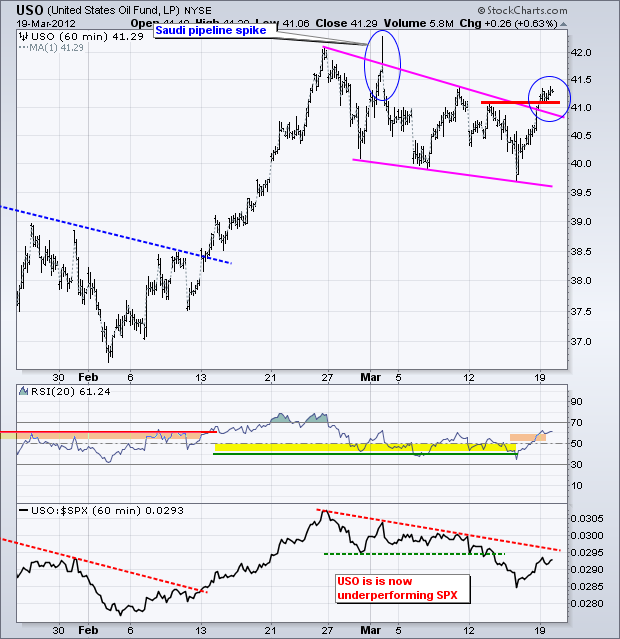
Oil got another boost from weakness in the Dollar and strength in the stock market. On the price chart, the US Oil Fund (USO) broke falling wedge resistance and RSI moved above 60. Technically, this signals a continuation higher and targets a move above the February high. This breakout could fail if the stock market weakens and the Dollar strengthens. A Dollar breakout and USO move below 40.70 would argue for a reassessment.
**************************************************************************
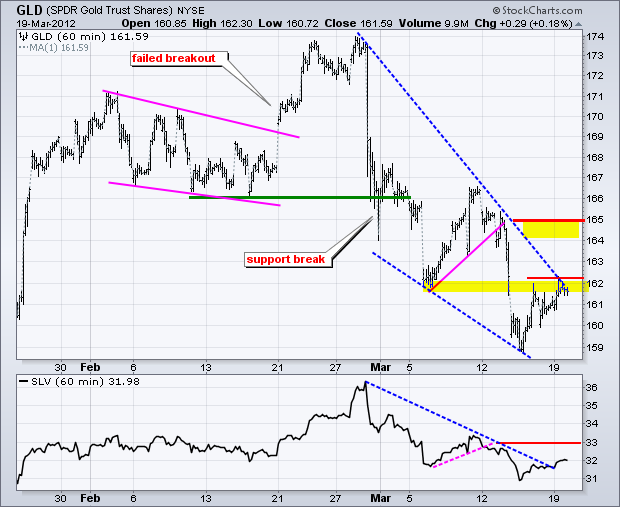
The Gold SPDR (GLD) bounced back above 161 the last few days, but remains in a downtrend overall and performance is not impressive. Broken support in the 162 area turns first resistance and this level held on Monday. A convincing break above 162 is the first step to a trend change. Key resistance remains at 165 for now.
**************************************************************************
Key Economic Reports:
Tue - Mar 20 - 08:30 - Housing Starts/Building Permits
Wed - Mar 21 - 07:00 - MBA Mortgage Index
Wed - Mar 21 - 10:00 - Existing Home Sales
Wed - Mar 21 - 10:30 - Crude Inventories
Thu - Mar 22 - 08:30 - Initial Claims
Thu - Mar 22 - 10:00 - FHFA Housing Price Index
Thu - Mar 22 - 10:00 - Leading Indicators
Fri - Mar 23 - 10:00 - New Home Sales
Charts of Interest: Tuesday and Thursday in separate post.
This commentary and charts-of-interest are designed to stimulate thinking. This analysis is not a recommendation to buy, sell, hold or sell short any security (stock ETF or otherwise). We all need to think for ourselves when it comes to trading our own accounts. First, it is the only way to really learn. Second, we are the only ones responsible for our decisions. Think of these charts as food for further analysis. Before making a trade, it is important to have a plan. Plan the trade and trade the plan. Among other things, this includes setting a trigger level, a target area and a stop-loss level. It is also important to plan for three possible price movements: advance, decline or sideways. Have a plan for all three scenarios BEFORE making the trade. Consider possible holding times. And finally, look at overall market conditions and sector/industry performance.

