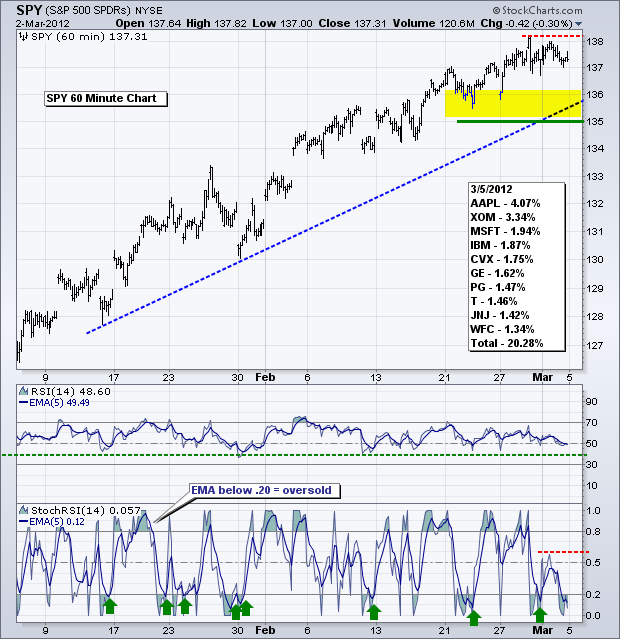
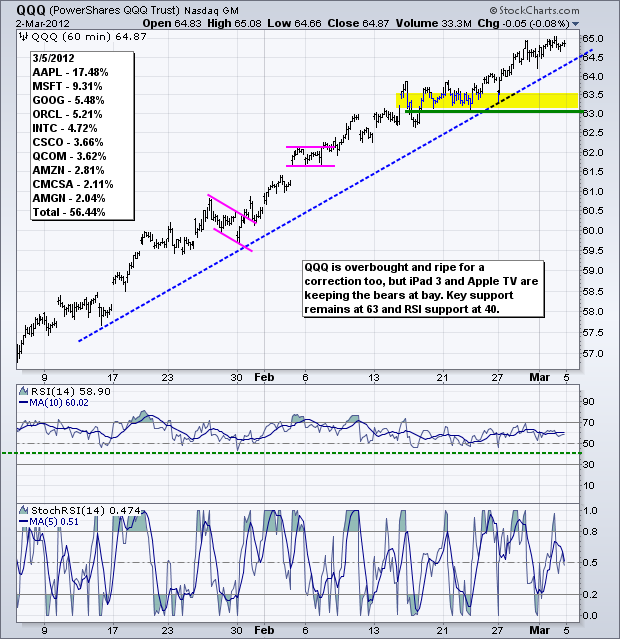
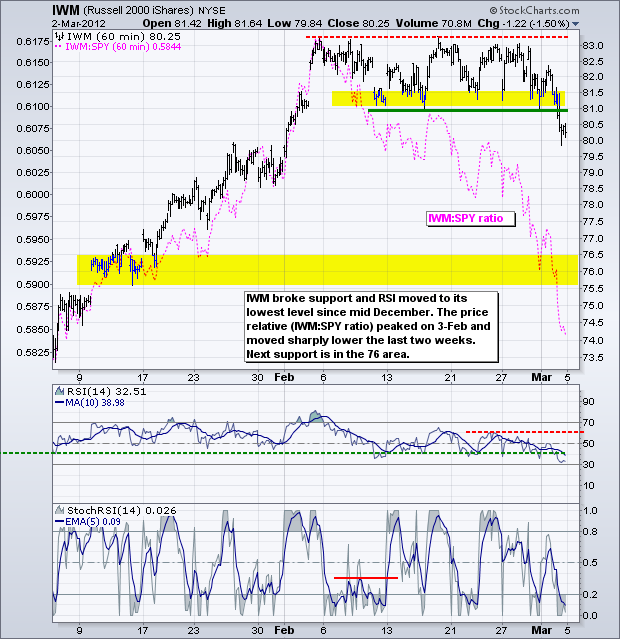
The S&P 500 ETF and Nasdaq 100 ETF remain in uptrends, but the Russell 2000 ETF broke support and the Dollar ETF appears to be breaking out. Relative weakness in small-caps and strength in the greenback could further weigh on stocks, which are still overbought and ripe for a corrective period. A correction can evolve as a sideways consolidation or a pullback. On the price chart, SPY remains in an uptrend overall with key support at 135 and RSI support at 40. Turning bearish now would be a top picking exercise with above average risk of failure. In other words, turning bearish now would be fighting the trend, even though it is overextended and ripe for a correction. Keep this in mind if making an aggressive play.
StochRSI and its 5-day EMA are shown in the lower window. This is the Stochastic Oscillator applied to RSI. I use the 5-day EMA to smooth out this volatile indicator a little. StochRSI measures the momentum of momentum. In a bigger uptrend, SPY is short-term oversold when the 5-day EMA moves below .20 and a buy signal is triggered with a subsequent move back above the .20 or .50 levels. The first is for aggressive traders, while a centerline crossover (.50) signals that the cup is half full again. Some traders even use a little buffer and require a move above .60 (red dotted line). Over the last two weeks, the 5-day EMA dipped below .20 twice and did not make it back above .50, which is the centerline. The momentum of momentum shows short-term weakness that could foreshadow a support test in the 135-136 area. Economically, it is going to be a busy week with Factory Orders and ISM Services on Wednesday, the ADP Employment Report on Thursday and the Non-Farm Payrolls on Friday.
**************************************************************************
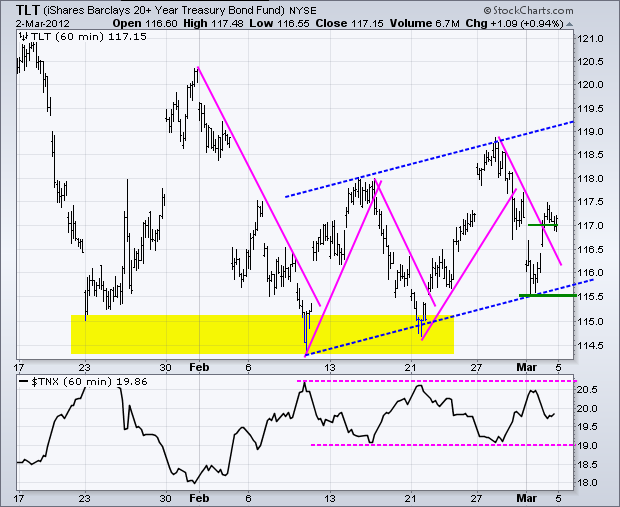
After a weak open on Monday, the 20+ Year T-Bond ETF (TLT) quickly firmed and formed a higher low last week. Overall, TLT has been zigzagging higher since the second week of February with a series of higher highs and higher lows. The break above 117 turns the swing up and I am setting initial support at 115.50. This week's economic reports will keep Treasuries on the hot seat this week, especially Friday's employment report. Signs of economic strength and strong job growth would be bearish for treasuries, while signs of economic weakness and weak job growth would be bullish.
**************************************************************************
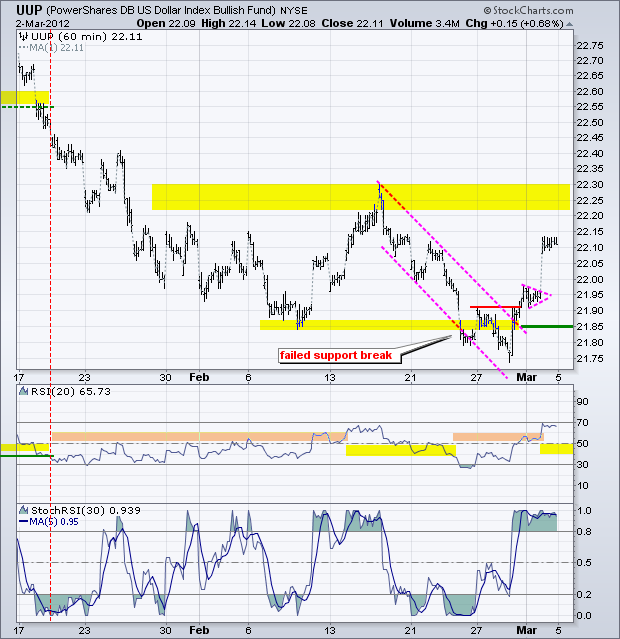
The US Dollar Fund (UUP) broke channel resistance, consolidated and broke consolidation resistance with another surge on Friday. The combination pushed RSI above resistance at 60 to turn momentum bullish. With a failed support break in late February and two strong days last week, I am turning bullish on the greenback again. Key support is set at 21.85 for now.
**************************************************************************
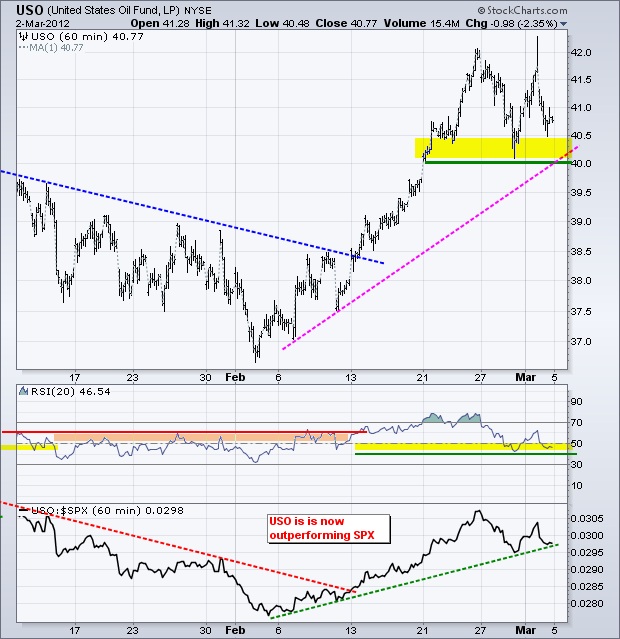
If stocks start a correction and the Dollar bounces, then the US Oil Fund (USO) could come under pressure and follow stocks lower. USO surged above 40 and then moved into a choppy range fueled by rumors of a Saudi pipeline explosion. With the late February bounce, key support is set in the 40-40.50 area. A break below this level would argue for a short-term downtrend with an initial target in the 38.5-39 area. RSI is in its support zone and a break below 40 would be bearish for momentum.
**************************************************************************
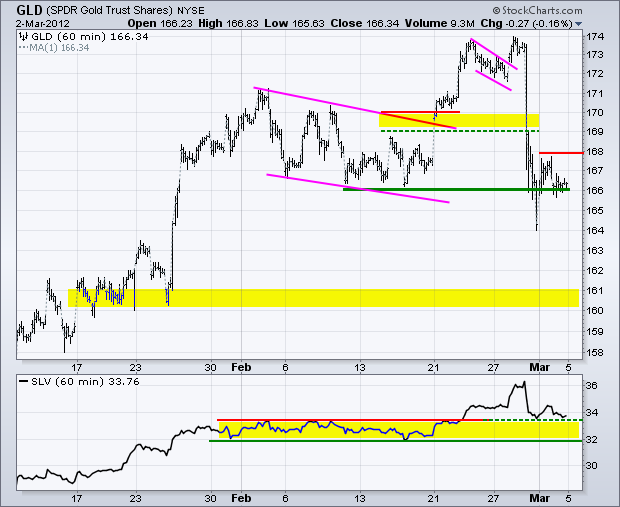
The Gold SPDR (GLD) tried to bounce and failed at 168. A break above this level is needed to solidify support and keep the uptrend alive here. With a breakout in the Dollar, this looks unlikely and the second shoe may be about to drop here. The next support zone is in the 160 area.
**************************************************************************
Key Economic Reports:
Mon - Mar 05 - 10:00 - Factory Orders
Mon - Mar 05 - 10:00 - ISM Services
Wed - Mar 07 - 07:00 - MBA Mortgage Index
Wed - Mar 07 - 08:15 - ADP Employment Change
Wed - Mar 07 - 10:30 - Oil Inventories
Wed - Mar 07 - 15:00 - Consumer Credit
Thu - Mar 08 - 07:30 - Challenger Job Cuts
Thu - Mar 08 - 08:30 - Jobless Claims
Fri - Mar 09 - 08:30 - Employment Report
Charts of Interest: Tuesday and Thursday in separate post.
This commentary and charts-of-interest are designed to stimulate thinking. This analysis is not a recommendation to buy, sell, hold or sell short any security (stock ETF or otherwise). We all need to think for ourselves when it comes to trading our own accounts. First, it is the only way to really learn. Second, we are the only ones responsible for our decisions. Think of these charts as food for further analysis. Before making a trade, it is important to have a plan. Plan the trade and trade the plan. Among other things, this includes setting a trigger level, a target area and a stop-loss level. It is also important to plan for three possible price movements: advance, decline or sideways. Have a plan for all three scenarios BEFORE making the trade. Consider possible holding times. And finally, look at overall market conditions and sector/industry performance.

