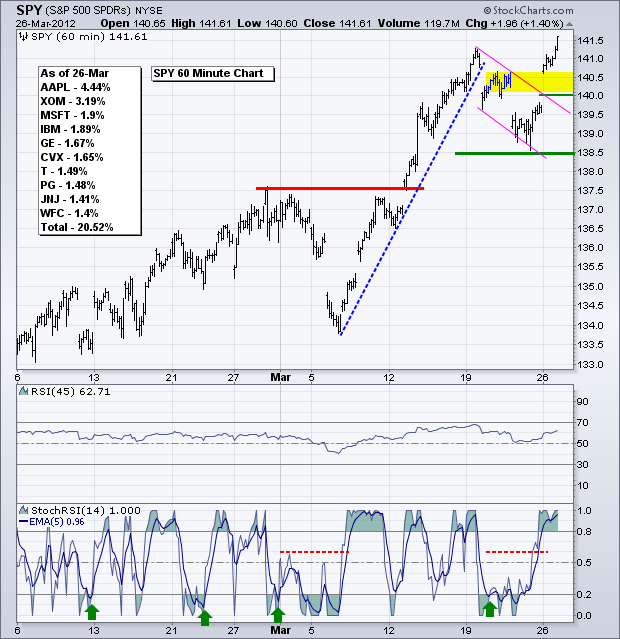
Stocks moved sharply higher on Monday with small-caps leading the charge. Sector-wise, the technology, consumer discretionary, finance, industrials and healthcare sectors gained over 1.5% to show upside leadership. It was yet another a broad market surge within an uptrend that began way back on 19-Dec. On the S&P 500 ETF (SPY) chart, the ETF fell to the 138.5 area with a falling flag and broke flag resistance with a gap. StochRSI offered the only way to play this breakout because this sensitive momentum oscillator broke above .60 on Friday morning, a day before the price breakout. With SPY back above 141.50, the uptrend is affirmed and short-term conditions are once again overbought. Broken resistance in the 140-140.5 area turns into first support. Key support is now set at 138.50.
Before moving further, note that I set RSI at 45 periods on the 60-minute chart for SPY. This is a little experiment in trend fitting, or curve fitting as some may call it. Basically, the assumption is that RSI should hold 40 in an uptrend. 14-period RSI broke 40 in early March and last week, but the uptrend in SPY continued with the ETF hitting new highs soon thereafter. A 45-period RSI, on the other hand, held 40 in early March and 50 last week to capture the uptrend. A break below 40 would, perhaps, signal an end to this uptrend. Of course, a deeper decline is now needed to push 45-period RSI below 40.
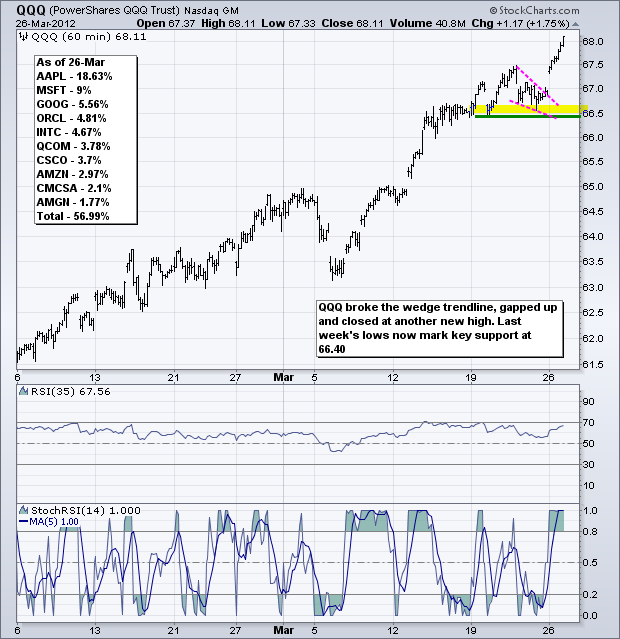
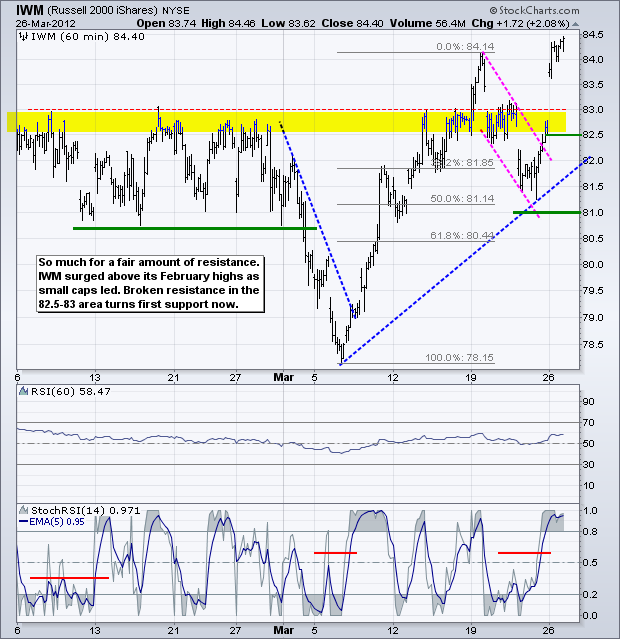
**************************************************************************
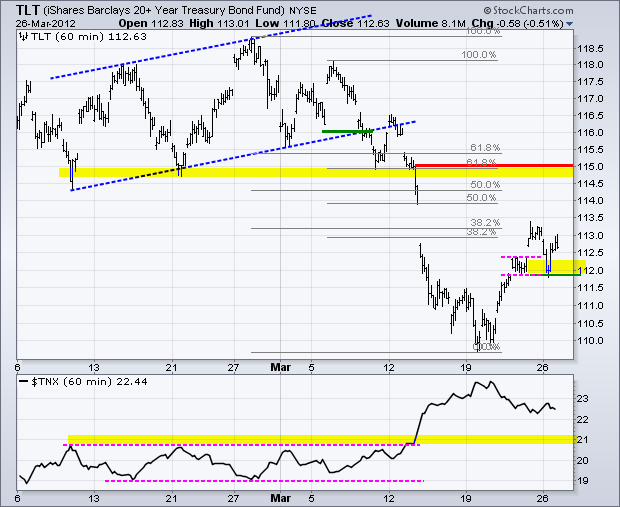
Treasuries held up quite well in the face of stock market strength. The 20+ Year T-Bond ETF (TLT) fell back to its prior consolidation and bounced to affirm support in the 112 area. A move below Monday's low would break support and argue for a test of the mid March low. Broken resistance and the Fibonacci clusters mark the next resistance zone in the 114.5-115 area.
**************************************************************************
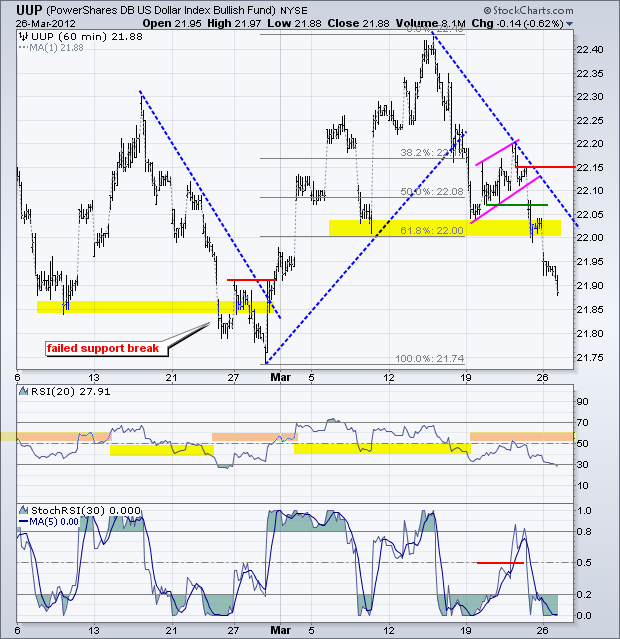
The US Dollar Fund (UUP) broke rising flag support last week and continued sharply lower on Monday. Broken support turns first resistance in the 22 area. Key resistance is set at 22.15 for now. RSI failed in the 50-60 zone and moved below 30 for the first time since late February, which marked a low in UUP. The greenback may be oversold, but it is definitely weak and in a downtrend.
**************************************************************************
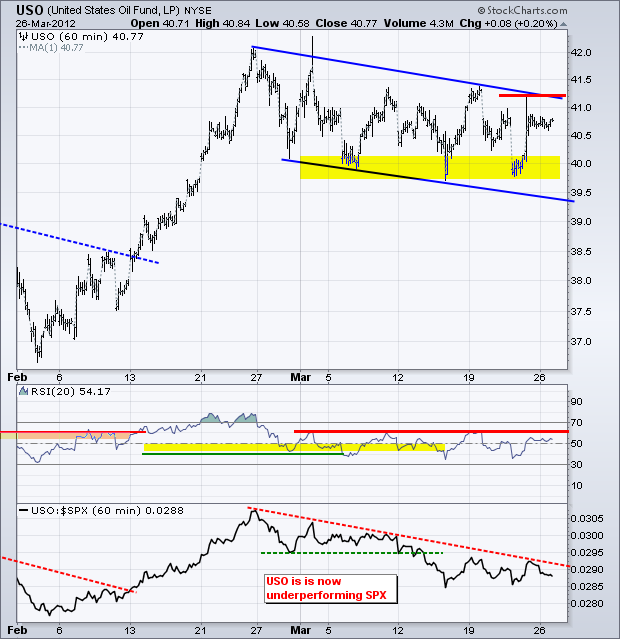
Oil had the perfect opportunity to surge on Monday, but did not and remained below resistance. Strength in the stock market and weakness in the Dollar should have boosted oil. Failure to advance on good news is negative. The falling channel remains in force to define the downtrend. I am setting key resistance at 41.30 and RSI resistance at 65.
**************************************************************************
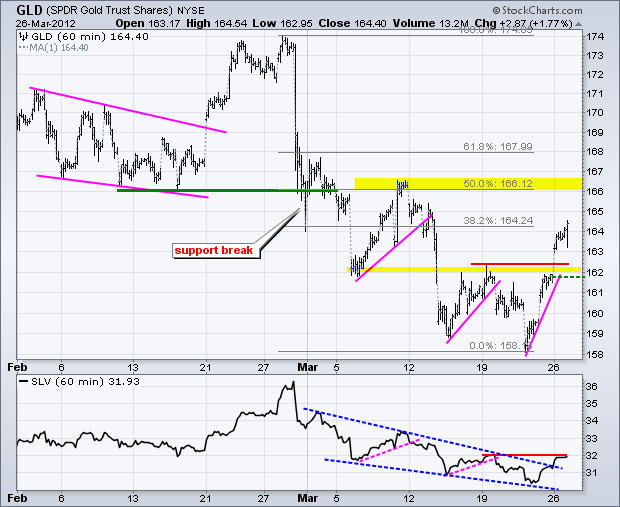
The Gold SPDR (GLD) broke the string of lower lows and lower highs with a surge above 163 on Monday. This breakout reverses the downtrend and broken resistance turns first support around 162. A strong breakout should hold and a move back below the breakout would question bullish resolve. Also note that the Silver Trust (SLV) has yet to breakout at 32.
**************************************************************************
Key Economic Reports:
Tue - Mar 27 - 09:00 - Case-Shiller 20-city Home Index
Tue - Mar 27 - 10:00 - Consumer Confidence
Wed - Mar 28 - 07:00 - MBA Mortgage Index
Wed - Mar 28 - 08:30 - Durable Orders
Wed - Mar 28 - 10:30 - Oil Inventories
Thu - Mar 29 - 08:30 - Jobless Claims
Thu - Mar 29 - 08:30 - GDP
Fri - Mar 30 - 08:30 - Personal Income & Spending
Fri - Mar 30 - 09:45 - Chicago PMI
Fri - Mar 30 - 09:55 - Michigan Sentiment
Charts of Interest: Tuesday and Thursday in separate post.
This commentary and charts-of-interest are designed to stimulate thinking. This analysis is not a recommendation to buy, sell, hold or sell short any security (stock ETF or otherwise). We all need to think for ourselves when it comes to trading our own accounts. First, it is the only way to really learn. Second, we are the only ones responsible for our decisions. Think of these charts as food for further analysis. Before making a trade, it is important to have a plan. Plan the trade and trade the plan. Among other things, this includes setting a trigger level, a target area and a stop-loss level. It is also important to plan for three possible price movements: advance, decline or sideways. Have a plan for all three scenarios BEFORE making the trade. Consider possible holding times. And finally, look at overall market conditions and sector/industry performance.

