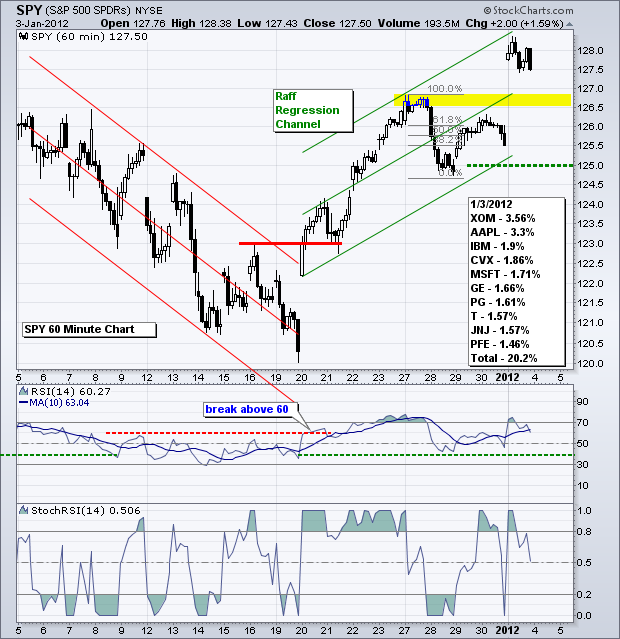
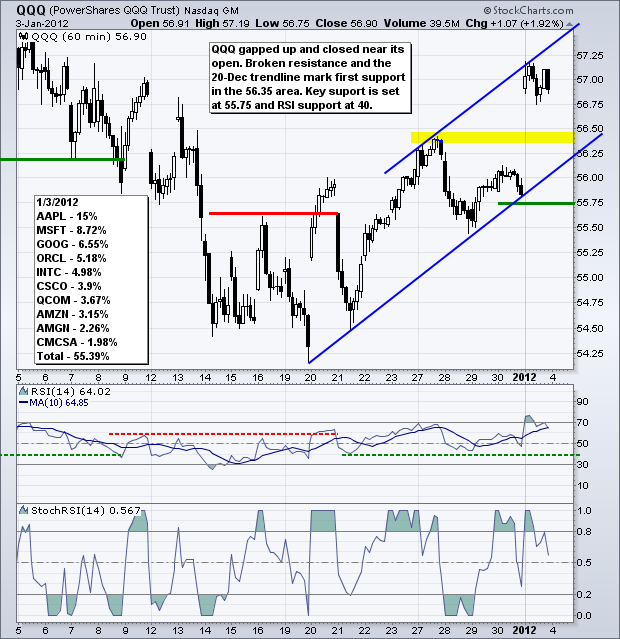
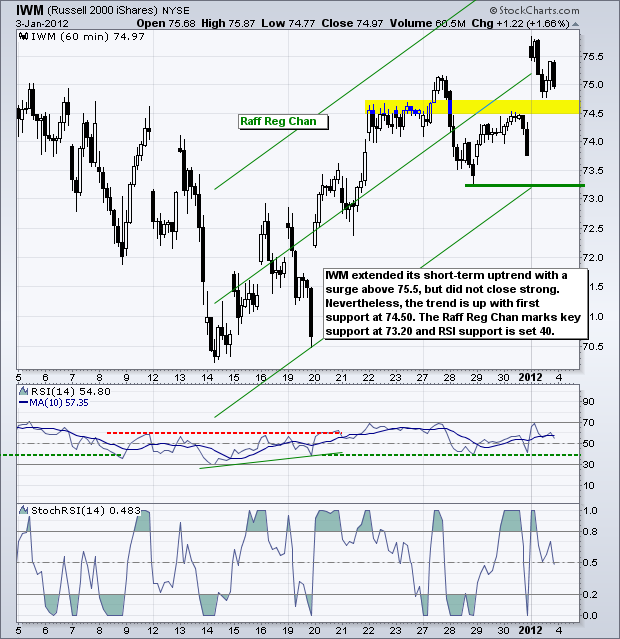
Stocks surged on the open, but did not follow through on these opening gains. The Nasdaq 100 ETF (QQQ) and S&P 500 ETF (SPY) held near their opening levels throughout the day, but the Russell 2000 ETF (IWM) and S&P MidCap 400 SPDR (MDY) sold off rather hard to close well below their opening levels. Such relative weakness in small and mid-caps on the first trading day of the year is not a good sign. Nevertheless, the major index ETFs remain in short-term uptrends with Tuesday's gaps marking the first support zones to watch. Failure to hold these gaps would be quite bearish. On the 60-minute chart, SPY surged above its late December high and this broken resistance zone turns first support in the 126.5 area. I adjusted the Raff Regression Channel so it extends from the 20-Dec open to the 3-Jan high. The lower trendline marks support in the 125-125.50 area. I will set key short-term support at 125. Combined with an RSI break below 40, a move below this level would clearly reverse the short-term uptrend.
**************************************************************************
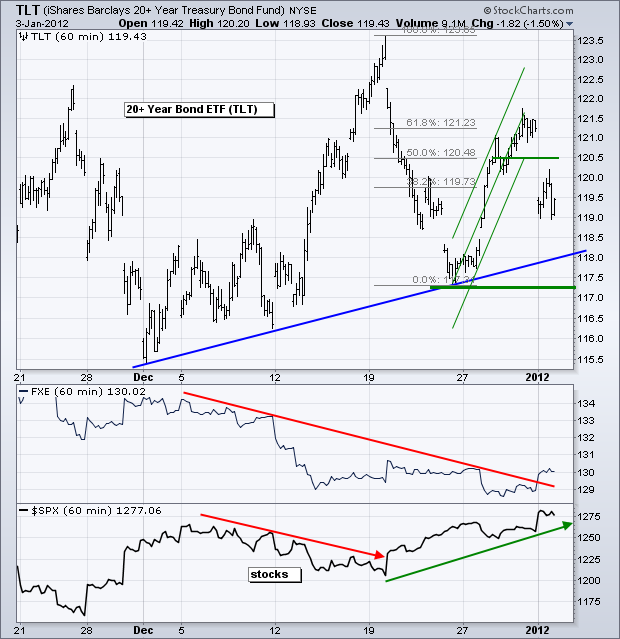
Strength in the Euro and the stock market weighed on US Treasuries. With the risk-on trading in full gear, the 20+ Year T-Bond ETF (TLT) opened sharply lower as stocks opened sharply higher. Again, the future of TLT depends on the Euro and the stock market. The bigger trend is up for TLT as the ETF forged a higher high in December. It is possible that a lower high formed with Tuesday's sharp decline, but a full trend reversal would not occur unless TLT breaks the late December low, which marks key support.
**************************************************************************
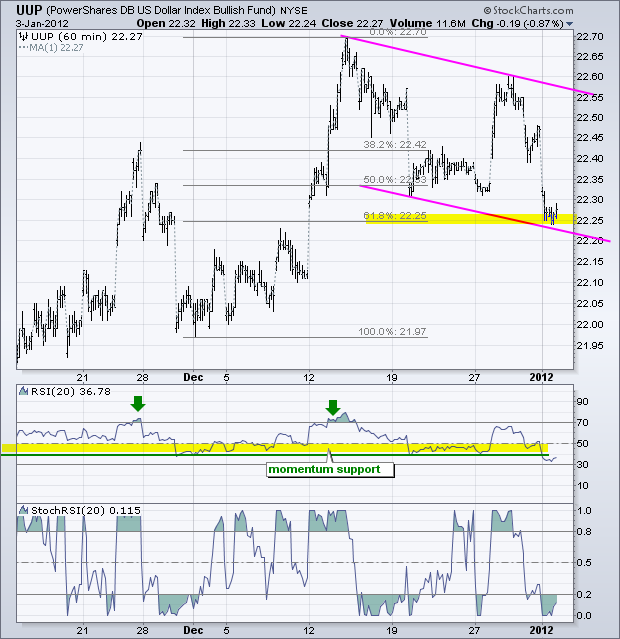
The US Dollar Fund (UUP) failed to hold its late December surge and moved below its 20-Dec low with Tuesday's decline. Overall, the bigger trend is up as the ETF surged to 22.70 in mid December. The decline over the last three weeks looks like a zigzag lower, perhaps even an ABC correction. Also notice that the decline retraced 61.80% of the prior advance. A sharp move back above 22.40 would provide the first clue that this correction is ending.
**************************************************************************
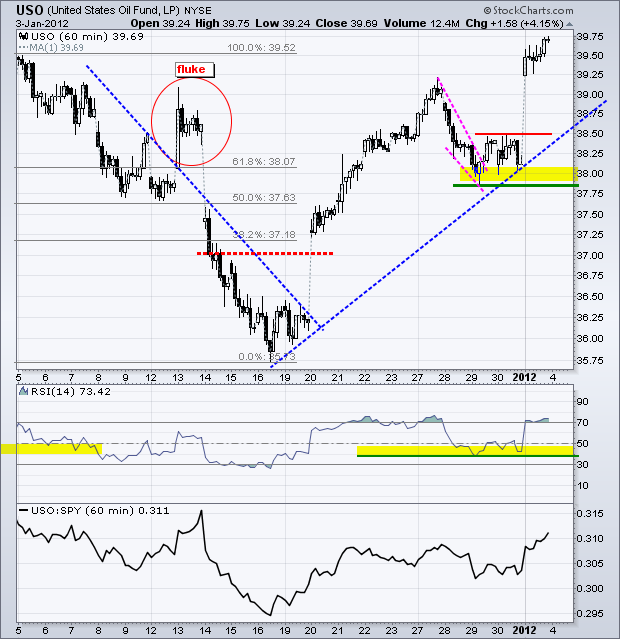
The US Oil Fund (USO) surged above its December high with a big move on Tuesday. Tensions in the Persian Gulf, strength in stocks and weakness in the Dollar all contributed to this surge. This move reinforces support from the late December lows. A break below this level is needed to reverse the short-term uptrend. RSI support is set at 40.
**************************************************************************
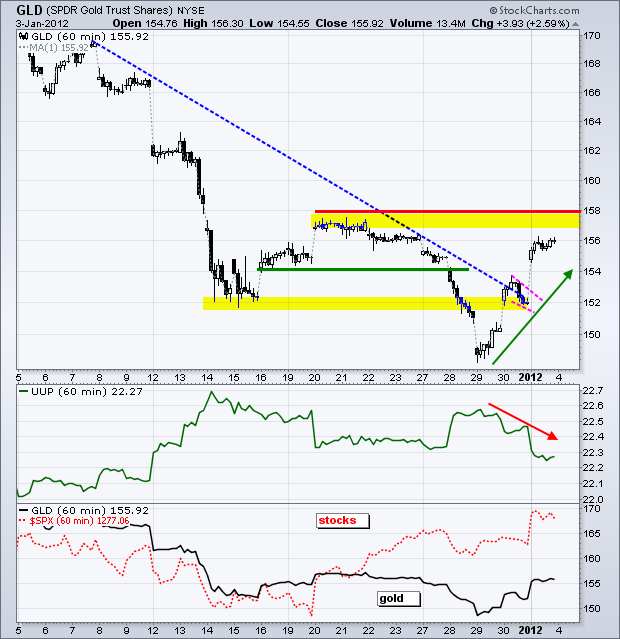
The Gold SPDR (GLD) made the most of the recent decline in the Dollar. The US Dollar Fund (UUP) fell the last three days and GLD surged around 5%. It is a huge move. Strength in the stock market also helped gold. Dependence on a weak Dollar could be the Achilles heel for gold, especially if the Euro crisis rears its ugly head soon. The Gold SPDR (GLD) is nearing resistance from the December peak around 157-158. Also note that the ETF is overbought after such a sharp surge in a short period of time.
**************************************************************************
Key Economic Reports:
Wed - Jan 04 - 07:00 - MBA Mortgage Index
Wed - Jan 04 - 10:00 - Factory Orders
Wed - Jan 04 - 14:00 - Auto/Truck Sales
Thu - Jan 05 - 07:30 - Challenger Job Cuts
Thu - Jan 05 - 08:15 - ADP Employment Report
Thu - Jan 05 - 08:30 - Jobless Claims
Thu - Jan 05 - 10:00 - ISM Services Index
Thu - Jan 05 - 11:00 - Oil Inventories
Fri - Jan 06 - 08:30 - Employment Report
Charts of Interest: Tuesday and Thursday in separate post.
This commentary and charts-of-interest are designed to stimulate thinking. This analysis is not a recommendation to buy, sell, hold or sell short any security (stock ETF or otherwise). We all need to think for ourselves when it comes to trading our own accounts. First, it is the only way to really learn. Second, we are the only ones responsible for our decisions. Think of these charts as food for further analysis. Before making a trade, it is important to have a plan. Plan the trade and trade the plan. Among other things, this includes setting a trigger level, a target area and a stop-loss level. It is also important to plan for three possible price movements: advance, decline or sideways. Have a plan for all three scenarios BEFORE making the trade. Consider possible holding times. And finally, look at overall market conditions and sector/industry performance.
