Today is the day – or rather two days. The European Central Bank (ECB) will make its policy statement and the 2-day EU summit starts. There are plenty of good reads and opinions regarding the EU situation. At the end of the day it boils down to probabilities and realities. What are the chances this summit will produce a serious and comprehensive solution that solves the EU debt problem? I think we all know the answer to that one. First, a change in the EU treaty requires approval from all members. There are 27 countries in the European Union, but only 17 are using the Euro. Getting approval from all 27 is never going to happen (think UK, Finland, Sweden). Getting approval from 17 is possible, but still a long shot. Heck, congress could not get results with an 8 person super committee that met for three months. Don't forget that each country has veto power and each country must get approval from parliament. Germany wants to impose fiscal restrictions on countries and automatic punishments via the EU court of justice. This means countries will have to give up some sovereignty to the central government. Hmmm, that sounds like a very tough sell. Of course, there is another kick-the-can-down-the-road proposal on the table. European Council President Herman Van Rompuy, a Belgian technocrat, proposed a "new fiscal compact" that would not need ratification by the individual parliaments. Even Van Rompuy admits this solution is not far reaching enough and real change can only come with treaty change.
So what is going to happen? My guess is we will see some sort of "new fiscal compact". The ECB is waiting on the results of this summit before making its move. My guess here is that the ECB will accept this result and become more accommodating. In short, we will probably get more half-baked solutions that will not solve the long-term problems. How the markets react is another question. Another half-bake may buy time yet again and be enough to rally stocks in the US or keep stocks range bound. Keep in mind that US stocks and the Dollar represent an alternative to EU stocks and the Euro. It's all relative. Relative to uncertain Europe, US stocks probably look good.
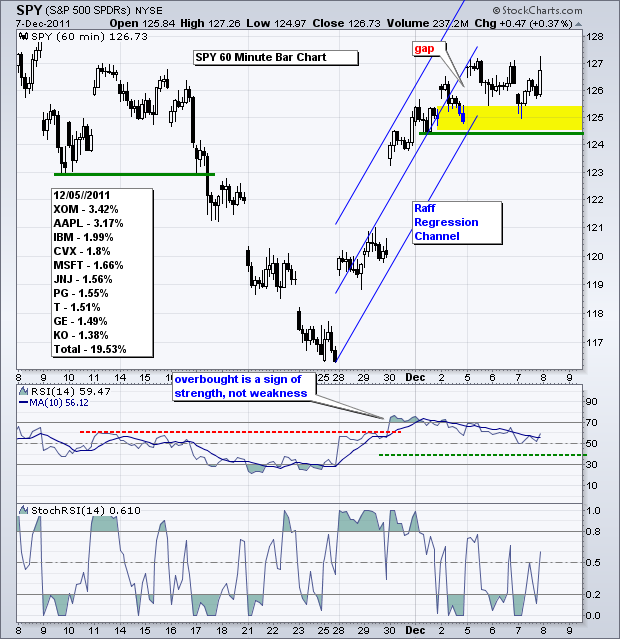
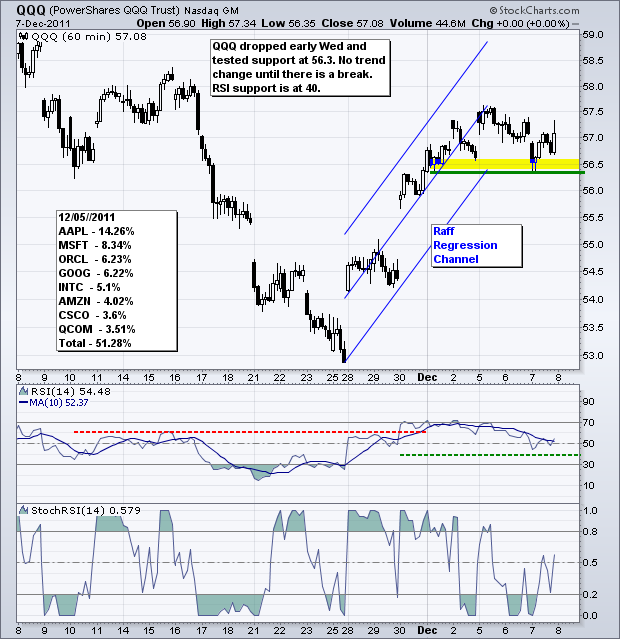
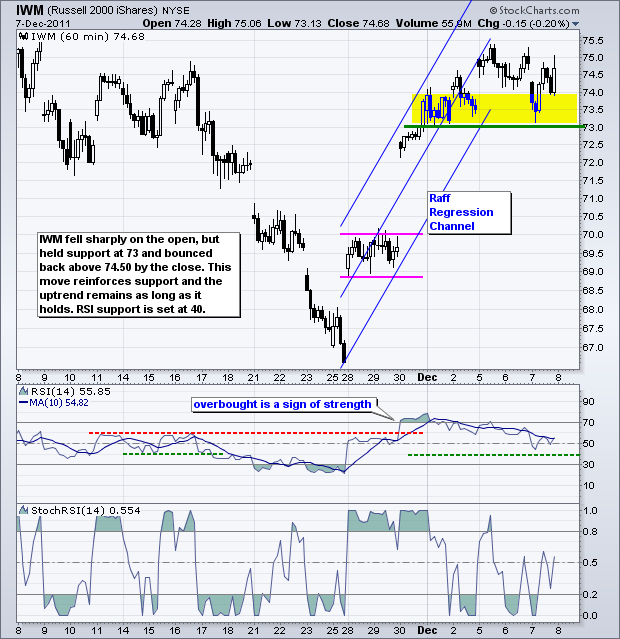
There are, of course, two more possibilities, a complete failure at the EU summit would likely result in a sharp move lower. A resounding success, which I find unlikely, would result in a sharp move higher. This looks like a good time to hedge your bets. There is no change on the S&P 500 ETF (SPY) chart. The ETF surged above 124 on December 1st and then consolidated the last six days. Trading has been very indecisive, but the gains are holding, which means the cup is half full. A clear support zone has taken shape in the 125 area (plus or minus 50 cents). A move below 124.4 would break support and reverse the short-term uptrend. RSI has support at 40 and a break below this level would turn short-term momentum bearish. The chances of whipsaw remain high as the markets will likely react to every live blog post and rumor coming out of Brussels over the next two days.
**************************************************************************
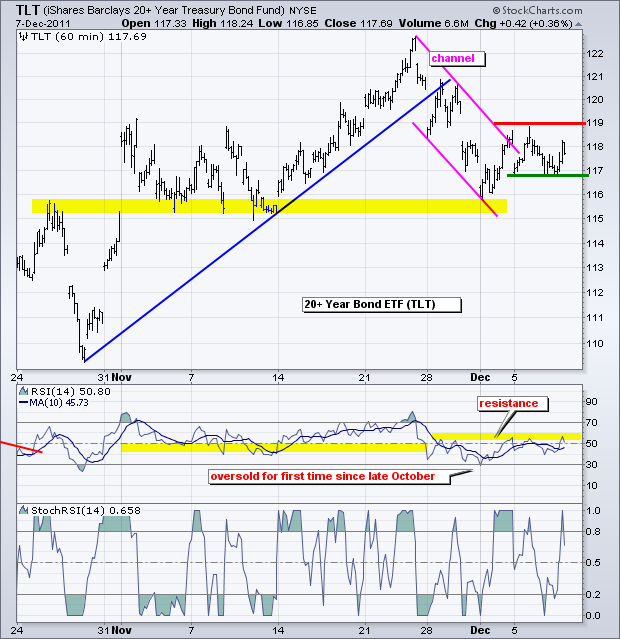
The 20+ year Bond ETF (TLT) is negatively correlated with stocks and the Euro. This means an advance in both would be bearish for Treasuries, while a decline in both would be bullish. On the chart, TLT consolidated the last few days with support at 116.8 and resistance at 119. Watch these levels for the next break. RSI is meeting resistance at 60. A break above 60 in RSI and 119 in TLT would be bullish.
**************************************************************************
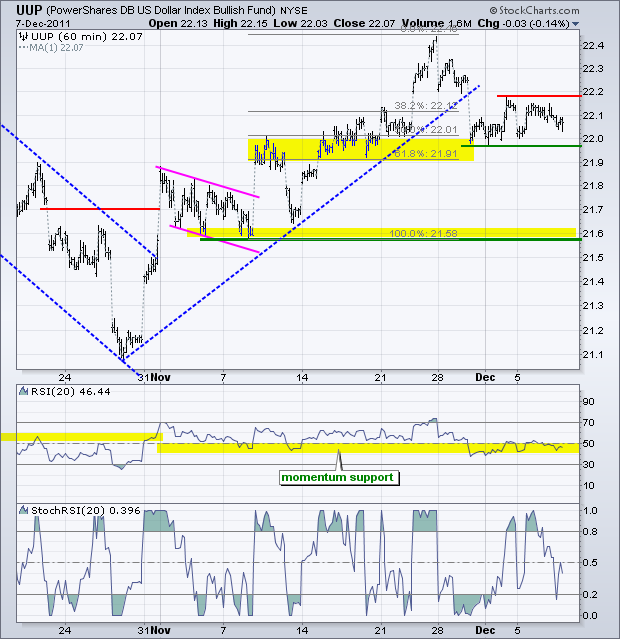
No change. The US Dollar Fund (UUP) continues to consolidate within a tight range. I am watching these boundaries for the next directional signal. RSI is also stuck in a range as it consolidates in the 40-50 zone. This zone acts as support in an uptrend. A break below 40 in RSI and 21.95 in UUP would be bearish. It could be a wild few days for the Euro and the Dollar. Lower interest rates and QE from the ECB might be seen as Euro bullish at first, but they are ultimately Euro bearish. Forex traders will also be watching the progress at the EU summit. Success would be Euro bullish, while failure would be Euro bearish.
**************************************************************************
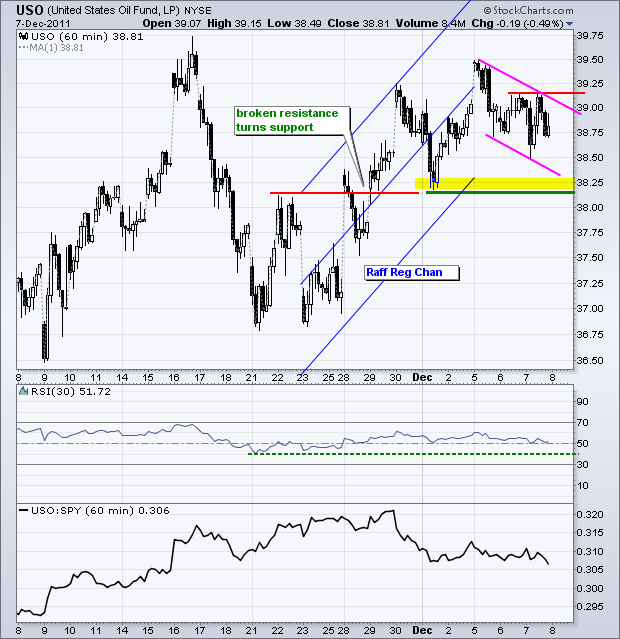
No change. The US Oil Fund (USO) continues to work its way higher with a rising zigzag since November 23rd. Broken resistance turned into support in the 38.25 area. The end of the Raff Regression Channel confirms support here. A move below the early December low would break this support zone and reverse the short-term uptrend. Oil and stocks have been positively correlated this year so keep an eye on stocks for clues on energy demand.
**************************************************************************
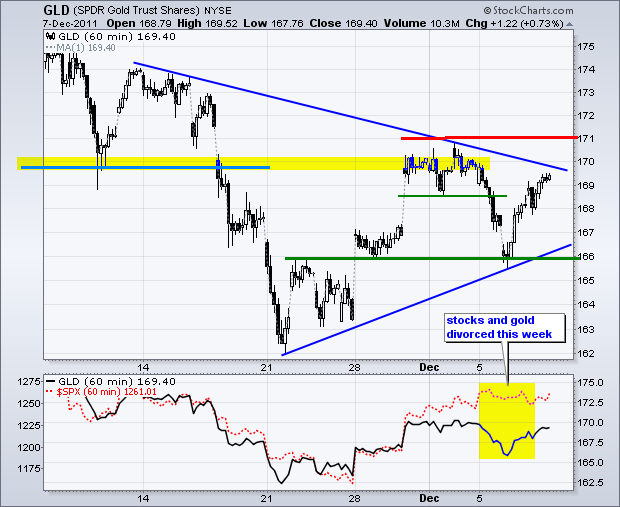
No change. The noose is tightening as surges and the pullbacks in the Gold SPDR (GLD) grow shorter. This makes for a Symmetrical Triangle over the last few weeks. GLD broke minor support on Monday and declined to key support at 166. The ETF got a nice bounce on Tuesday afternoon to affirm this support level. The long-term trend for gold is still up so I will still give the bulls the benefit of the doubt as long as support at 166 holds.
**************************************************************************
Key Economic Reports:
Thu - Dec 08 – 08:00 – 2-day EU Summit Begins
Thu - Dec 08 - 08:30 - Jobless Claims
Thu - Dec 08 - 08:30 – ECB Policy Statement
Thu - Dec 08 - 10:00 - Wholesale Inventories
Fri - Dec 09 - 09:55 - Michigan Sentiment
Charts of Interest: Tuesday and Thursday in separate post.
This commentary and charts-of-interest are designed to stimulate thinking. This analysis is not a recommendation to buy, sell, hold or sell short any security (stock ETF or otherwise). We all need to think for ourselves when it comes to trading our own accounts. First, it is the only way to really learn. Second, we are the only ones responsible for our decisions. Think of these charts as food for further analysis. Before making a trade, it is important to have a plan. Plan the trade and trade the plan. Among other things, this includes setting a trigger level, a target area and a stop-loss level. It is also important to plan for three possible price movements: advance, decline or sideways. Have a plan for all three scenarios BEFORE making the trade. Consider possible holding times. And finally, look at overall market conditions and sector/industry performance.

