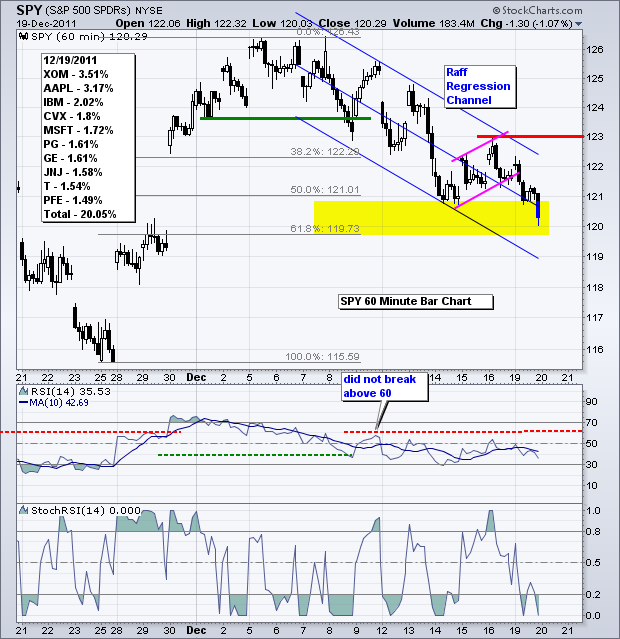
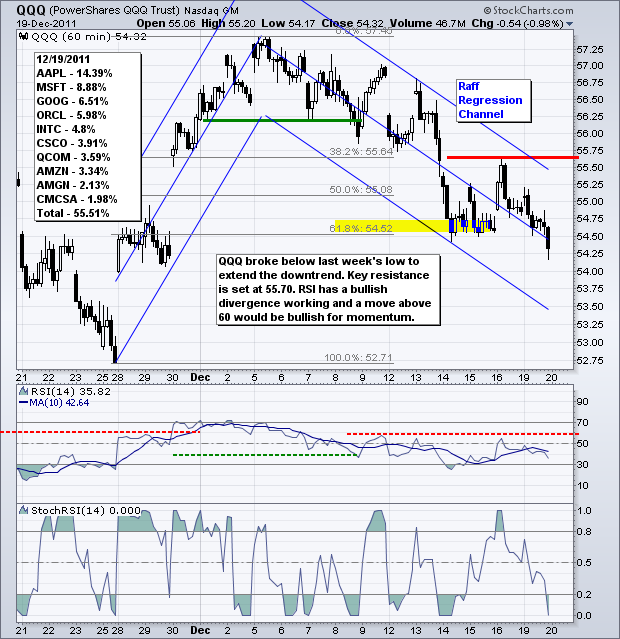
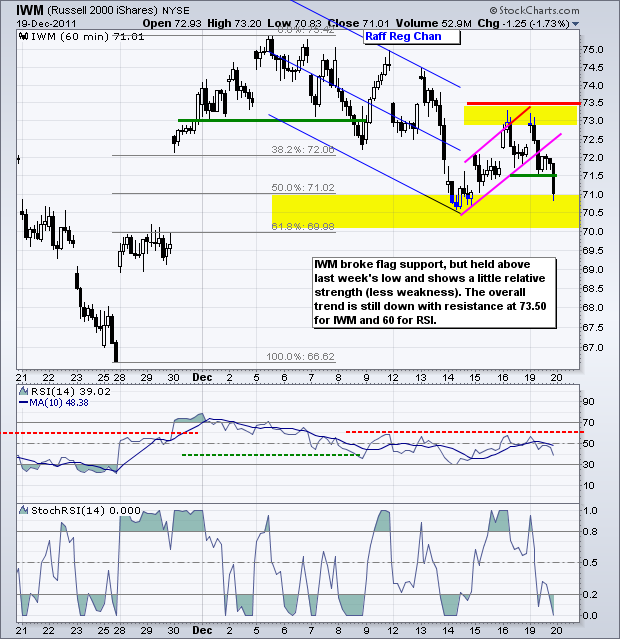
Now that everyone has officially given up on the Santa Claus rally and stocks are oversold, perhaps we will get that rally. The S&P 500 ETF (SPY) remains in a falling price channel that is defined by the Raff Regression Channel. Key resistance is set at 123. Within the channel, SPY broke rising flag support early Monday and declined to the bottom of the 50-61.80% retracement zone. Despite this decline, RSI held above 30 and has a bullish divergence working. This is a spot for bottom pickers because there are no signs of buying pressure or firmness yet. The Fibonacci Retracements Tool and oversold conditions are the only two indicators pointing to a bounce. With the bigger trend down and buyers on the sidelines, I would expect resistance in the 122-123 area.
**************************************************************************
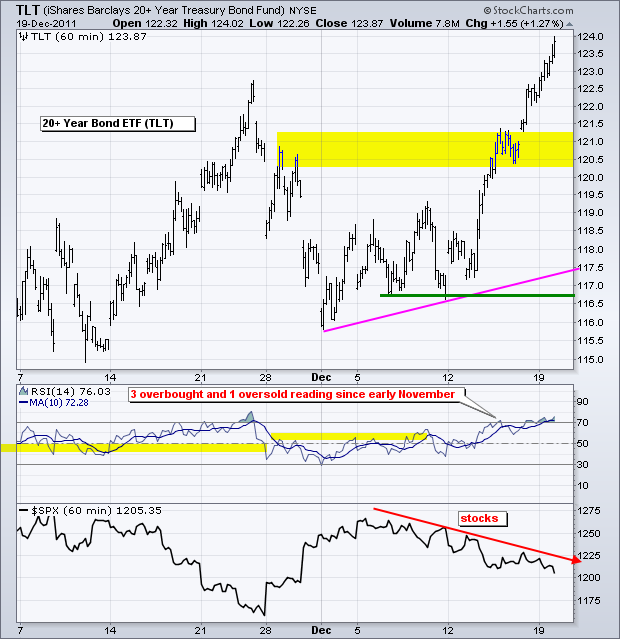
US Treasuries continue to soar in a yearend flight to safety. While I do not expect the Eurozone to breakup or the Euro to dissolve, money is moving out of this zone because of above average risk. This is causing a flight to US Treasuries, which is the deepest and most liquid market in the world. The 20+ year Bond ETF (TLT) is overbought as the move from 117 to 124 goes parabolic. I am marking the first support zone around 120.5-121.
**************************************************************************
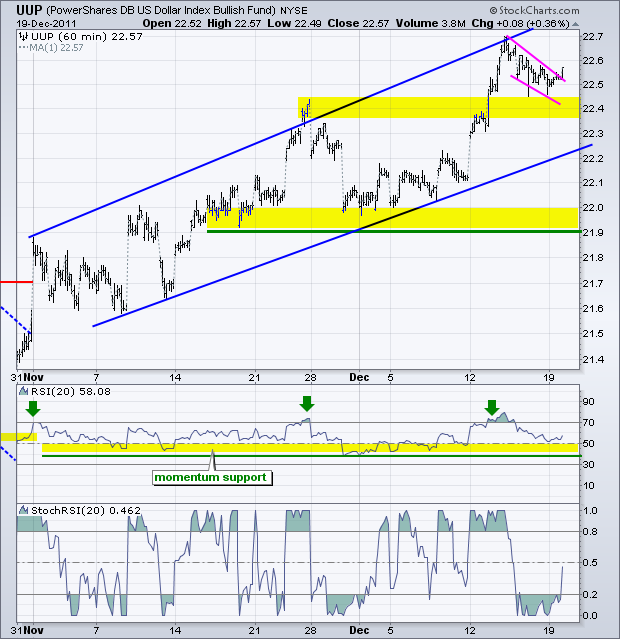
The US Dollar Fund (UUP) formed a falling flag/wedge late last week and broke resistance on Monday. The Euro was oversold and the Dollar was overbought after last week's big surge. This small pullback helped alleviate these conditions. The first support zone is set around 22.40 and RSI support is set in the 40-50 zone.
**************************************************************************
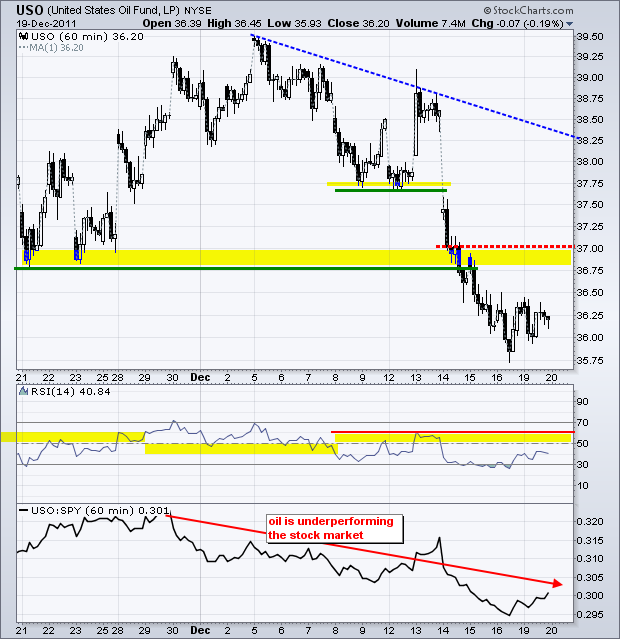
An oversold bounce in the stock market could give way to an oversold bounce in oil. The US Oil Fund (USO) broke support with a sharp decline last week and broken support in the 36.75-37 area turns into first resistance. Even a breakout above this zone would not be enough to reverse the overall downtrend. I would still expect a lower high below 37.75.
**************************************************************************
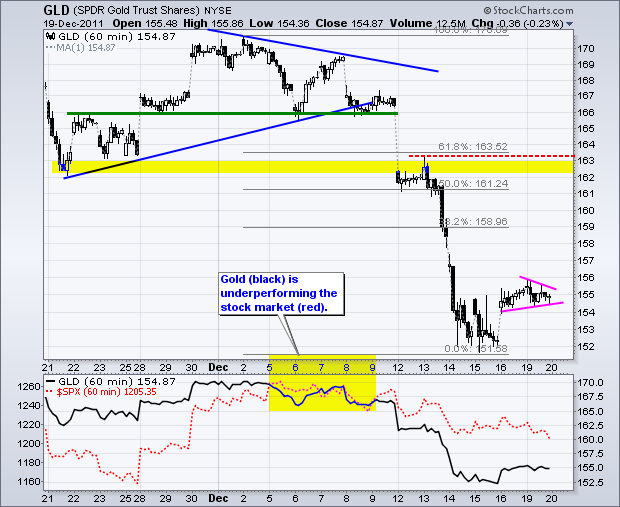
The Gold SPDR (GLD) held up quite well in the face of stock market weakness and Dollar strength. GLD surged above 155 late last week and consolidated with a small pennant. A break above pennant resistance would signal a continuation higher and extend the oversold bounce in bullion. The Fibonacci Retracements Tool marks the potential targets.
**************************************************************************
Key Economic Reports:
Tue - Dec 20 - 08:30 - Housing Starts/Building Permits
Wed - Dec 21 - 07:00 - MBA Mortgage Index
Wed - Dec 21 - 10:00 - Existing Home Sales
Wed - Dec 21 - 10:30 - Crude Inventories
Thu - Dec 22 - 08:30 - Initial Claims
Thu - Dec 22 - 08:30 - GDP
Thu - Dec 22 - 09:55 - Michigan Sentiment
Thu - Dec 22 - 10:00 - Leading Indicators
Fri - Dec 23 - 08:30 - Durable Orders
Fri - Dec 23 - 08:30 - Personal Income/Personal Spending
Fri - Dec 23 - 10:00 - New Home Sales
Charts of Interest: Tuesday and Thursday in separate post.
This commentary and charts-of-interest are designed to stimulate thinking. This analysis is not a recommendation to buy, sell, hold or sell short any security (stock ETF or otherwise). We all need to think for ourselves when it comes to trading our own accounts. First, it is the only way to really learn. Second, we are the only ones responsible for our decisions. Think of these charts as food for further analysis. Before making a trade, it is important to have a plan. Plan the trade and trade the plan. Among other things, this includes setting a trigger level, a target area and a stop-loss level. It is also important to plan for three possible price movements: advance, decline or sideways. Have a plan for all three scenarios BEFORE making the trade. Consider possible holding times. And finally, look at overall market conditions and sector/industry performance.

