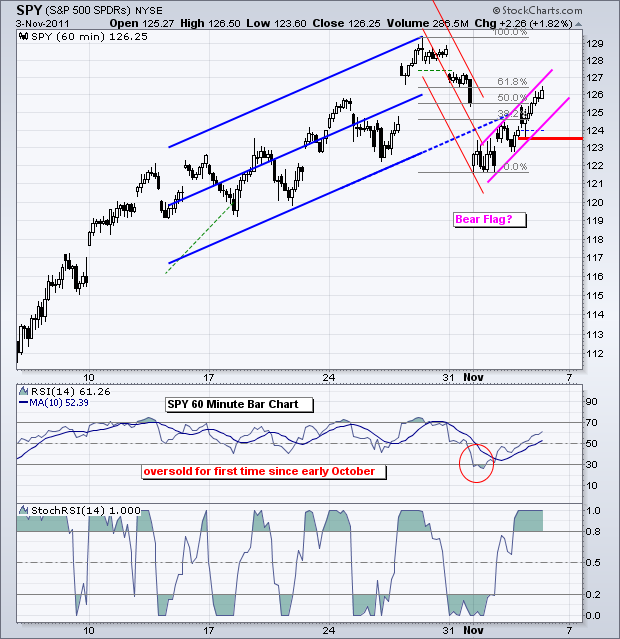
And now for the employment report...Friday's market is at the mercy of the employment report, or rather Wall Street's reaction to the report. The S&P 500 ETF (SPY) bounced off medium-term support in the 122-124 area with a move above 126 the last few days. This shows some resilience and keeps the October breakouts alive. These breakouts can be seen on a daily chart. Short-term, the trend is up as SPY works its way higher within a rising channel or flag. Notice that this advance retraced 61.80% of the prior decline. With SPY forming a potentially bearish continuation pattern and hitting a key retracement, the ETF is at its moment-of-truth. A move below the lower trendline and key support at 123.5 would reverse the 2-3 day advance and signal a continuation of the Monday-Tuesday decline. The indicator window shows RSI rising above 60 and StochRSI holding above the .80 level. Look for a move below 50 in RSI to confirm a trend change on the price chart.

**************************************************************************
Friday will also be a big day for Treasuries. The 20+ year Bond ETF (TLT) broke resistance with a big surge and pulled back with a small wedge. This looks like a minor correction so far. A break above 118 would end the pullback and signal a continuation of the prior surge.
**************************************************************************
The US Dollar Fund (UUP) continues to move in tandem with Treasuries. Weakness in the Euro pushes money in the safe-havens, especially severe weakness. There will no doubt be plenty of market moving rumors, statements and innuendo affecting the Euro in the coming weeks. UUP broke above resistance and then formed a falling flag, which is a bullish continuation pattern. A break above Thursday's high would signal a continuation higher.
**************************************************************************
The US Oil Fund (USO) continues to hold up better than the stock market. USO broke above the upper trendline of the falling flag. This is a bullish continuation pattern and the breakout signals a continuation of the prior advance. A lot still depends on the stock market, but the breakout is bullish as long as it holds. Minor support is set at 35.4 and key support is set at 34.50.
**************************************************************************
The Gold SPDR (GLD) bounced off support and moved above last week's high. Gold and oil are the big winners this week. The strong bounce off the support zone reinforces this level. Key support remains at 163.
**************************************************************************
Key Economic Reports:
Fri - Nov 04 - 08:30 - Employment Report
Charts of Interest: Tuesday and Thursday in separate post.
This commentary and charts-of-interest are designed to stimulate thinking. This analysis is not a recommendation to buy, sell, hold or sell short any security (stock ETF or otherwise). We all need to think for ourselves when it comes to trading our own accounts. First, it is the only way to really learn. Second, we are the only ones responsible for our decisions. Think of these charts as food for further analysis. Before making a trade, it is important to have a plan. Plan the trade and trade the plan. Among other things, this includes setting a trigger level, a target area and a stop-loss level. It is also important to plan for three possible price movements: advance, decline or sideways. Have a plan for all three scenarios BEFORE making the trade. Consider possible holding times. And finally, look at overall market conditions and sector/industry performance.


