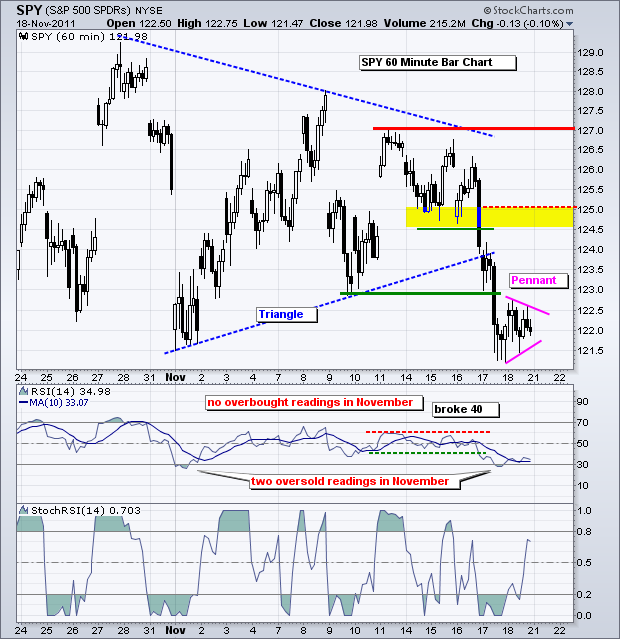
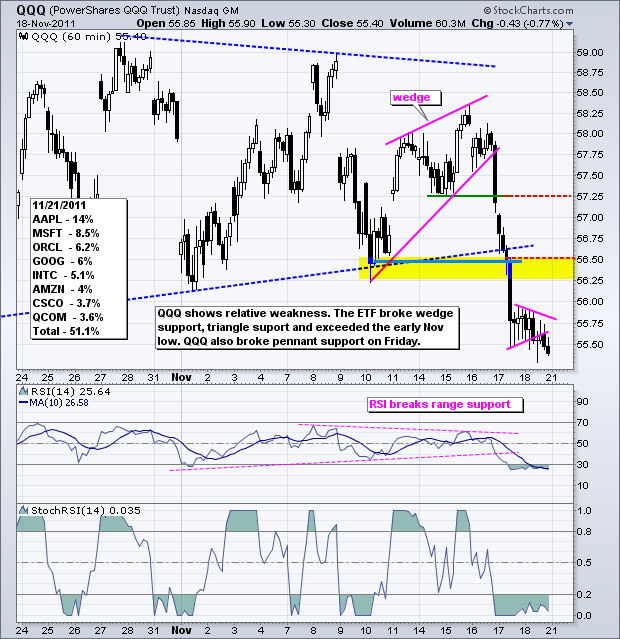
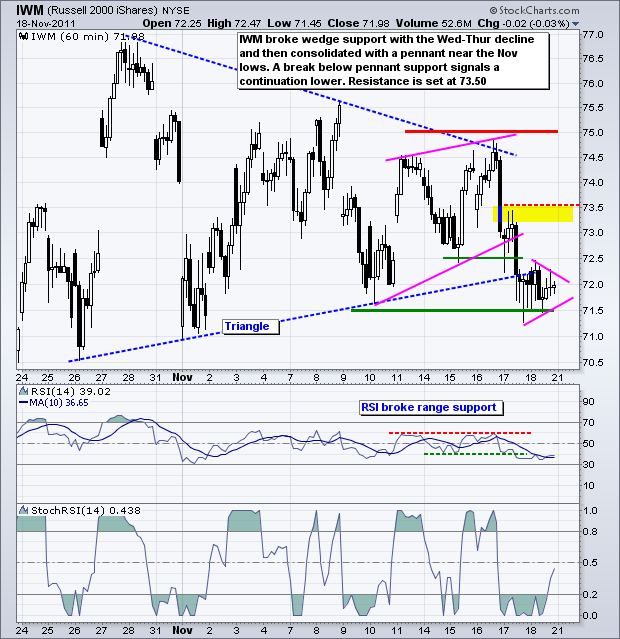
The risk-off trade remains the flavor of the month. Stocks broke down last week as the Dollar and Treasuries moved to their highest levels for November. The S&P 500 ETF (SPY) broke triangle support with a sharp decline on Wednesday-Thursday and then consolidated on Friday with a pennant or small triangle. There is possible support still around 122 from the November lows, but I think the triangle breakdown is the dominant chart feature on both the daily and 60-minute charts. This means we have a medium-term trend change in the making as well. A break from Friday's pennant would signal a continuation lower and target a move to around 119. The mid October lows mark support here. While a break above pennant resistance would be positive, this would still be considered an oversold bounce. I would not be impressed unless a bounce carried past resistance at 125.
**************************************************************************
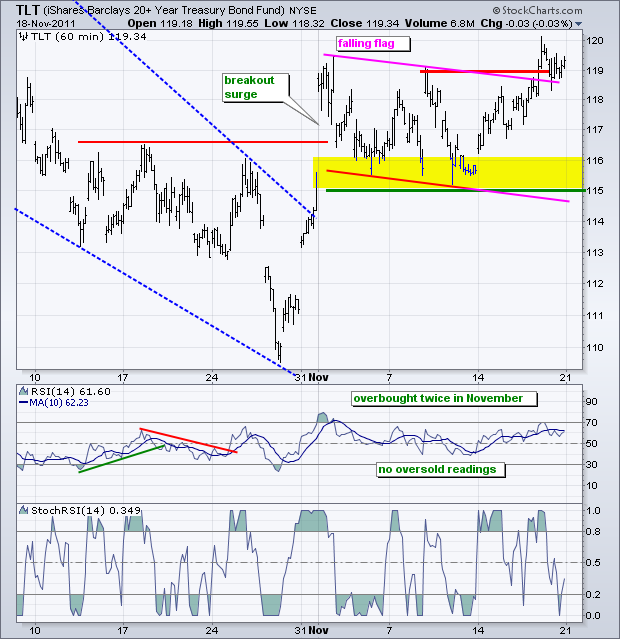
Even though government bonds do not seem like the best place to be right now, the 20+ year Bond ETF (TLT) continues to attract money as a relative safe-haven. On the price chart, TLT broke flag resistance with a surge from 115 to 120 last week. This is a pretty big move. Moreover, the bigger trend is up and this breakout is in harmony with that bigger trend. Treasuries and Stocks are negatively correlated and this is a bearish development for stocks.
**************************************************************************
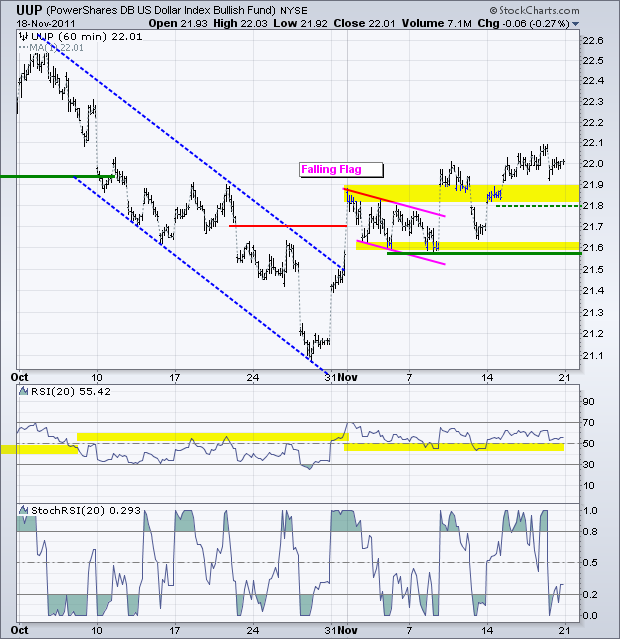
The US Dollar Fund (UUP) continues to benefit from the European woes and the risk-off environment. UUP broke flag resistance the second week of November and has been zigzagging higher the last three weeks. Key support remains at 21.60. RSI held support in the 40-50 zone in mid November and remains in bull mode as long as this level holds.
**************************************************************************
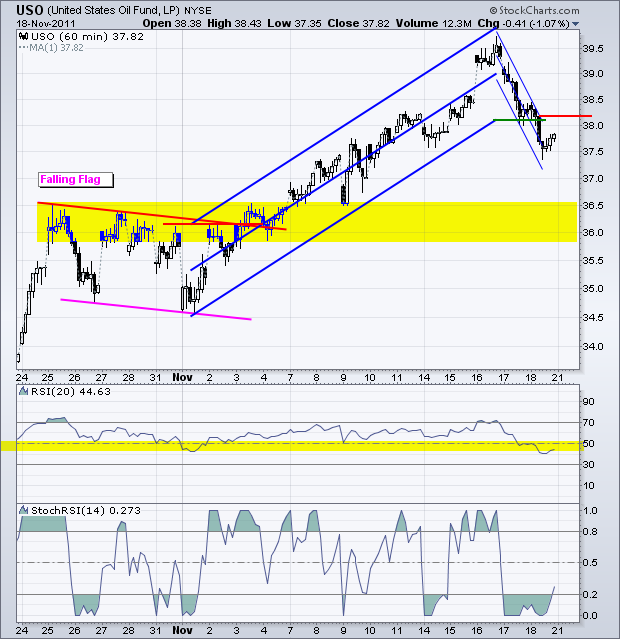
The US Oil Fund (USO) did a classic pop and drop mid week. The trend was clearly up as the ETF surged above 39.5 with a 5% move early in the week. This gain did not hold as the ETF moved right back to 37.50. It looks like some sort of buying climax that is likely to mark a top, especially if stocks continue lower and the Dollar moves higher. Using the Raff Regression Channel, I am marking first resistance at 38.20. Flag resistance turns into support for a downside target in the 36-36.50 area.
**************************************************************************
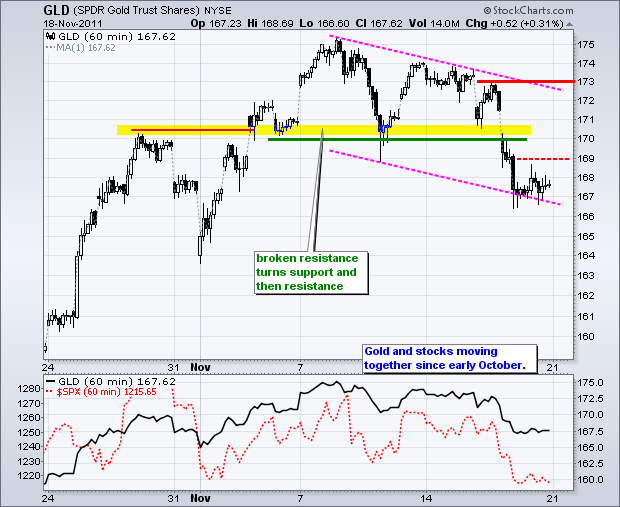
For whatever reason, stocks and gold have been positively correlated since early October. Perhaps the strong Dollar is weighing on gold. Perhaps cash strapped governments are selling gold to raise money (Italy). GLD broke support with a sharp decline on Wed-Thur and then formed a consolidation on Friday. The trading pattern is just like SPY. A break below consolidation support would signal a continuation lower with a downside target in the low 160s.
**************************************************************************
Key Economic Reports:
Mon - Nov 21 - 10:00 - Existing Home Sales
Tue - Nov 22 - 08:30 - GDP
Tue - Nov 22 - 14:00 - FOMC Minutes
Wed - Nov 23 - 07:00 - MBA Mortgage Index
Wed - Nov 23 - 08:30 - Initial Claims
Wed - Nov 23 - 08:30 - Personal & Spending
Wed - Nov 23 - 08:30 - Durable Orders
Wed - Nov 23 - 09:55 - Michigan Sentiment
Wed - Nov 23 - 10:30 - Oil Inventories
Thu – Nov 24 – 10:00 – Thanksgiving!!
Charts of Interest: Tuesday and Thursday in separate post.
This commentary and charts-of-interest are designed to stimulate thinking. This analysis is not a recommendation to buy, sell, hold or sell short any security (stock ETF or otherwise). We all need to think for ourselves when it comes to trading our own accounts. First, it is the only way to really learn. Second, we are the only ones responsible for our decisions. Think of these charts as food for further analysis. Before making a trade, it is important to have a plan. Plan the trade and trade the plan. Among other things, this includes setting a trigger level, a target area and a stop-loss level. It is also important to plan for three possible price movements: advance, decline or sideways. Have a plan for all three scenarios BEFORE making the trade. Consider possible holding times. And finally, look at overall market conditions and sector/industry performance.

