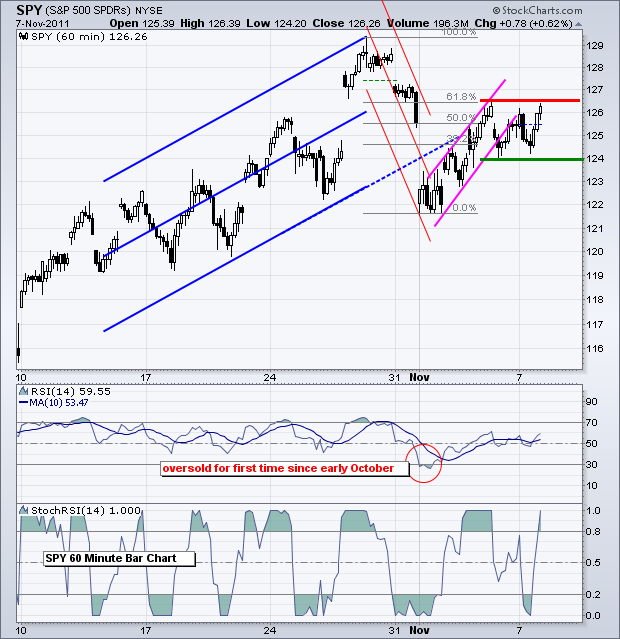
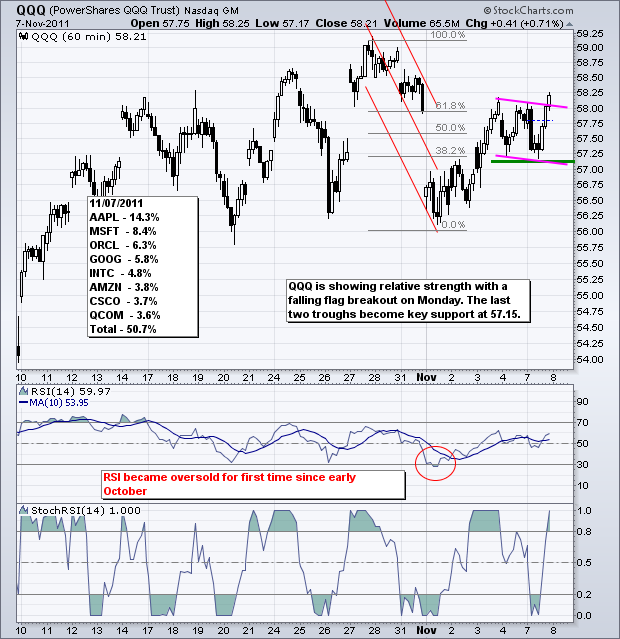
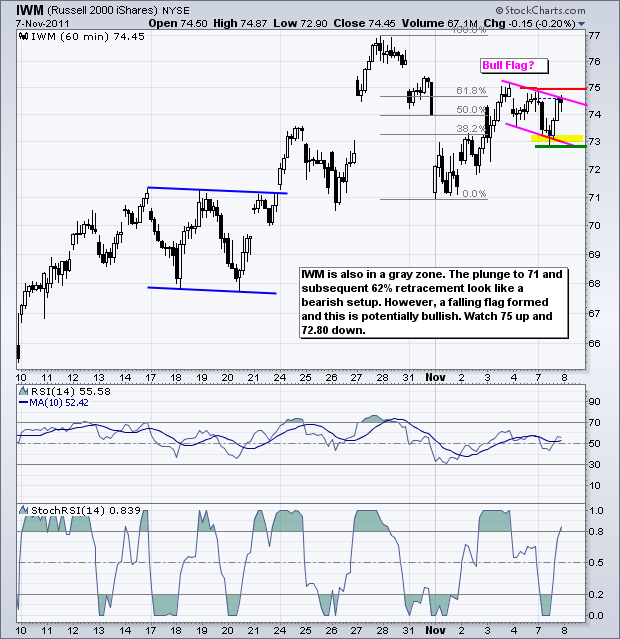
Even though SPY formed a bearish rising flag after the plunge to 122, the ETF has yet to break support as a flat consolidation formed the last few days. The ETF broke below the lower trendline of the rising flag on Friday, but quickly rebounded to establish support at 124. A second bounce further affirmed this level on Monday. Basically, we have a flat consolidation now with support at 124 and resistance at 126.50. Watch these levels for the next directional break (signal). It is tempting to lean one way or the other, but difficult to choose which way. The prior plunge and RSI dip below 30 suggest that a short-term downtrend has started and last week's bounce is corrective. However, the bulls are not going quietly and the medium-term trend (daily chart) remains up. Keep in mind that the broken resistance zone around 122-124 turns into a support zone – and it is holding. The medium-term trend carries more weight than the short-term trend.
**************************************************************************
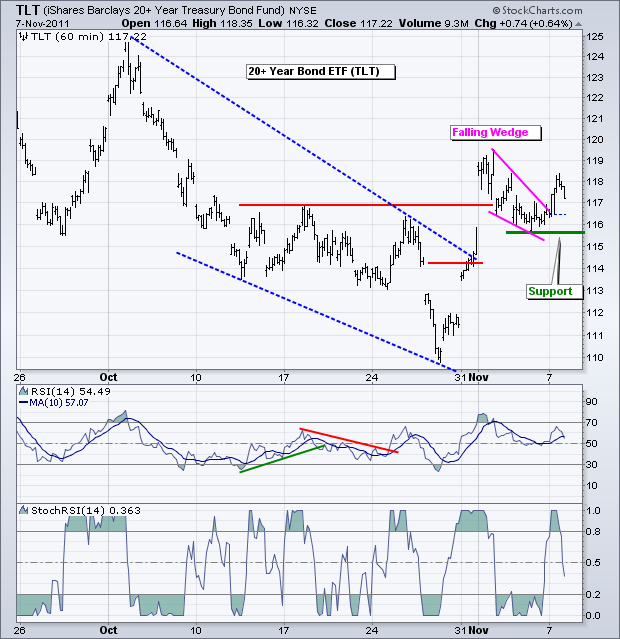
The 20+ year Bond ETF (TLT) broke wedge resistance with a surge above 117 on Monday. Technically, the short-term trend is up after the breakout and surge above 119. This decline was viewed as a pull back within a bigger uptrend. Key support is set at 115.50. Treasuries will most likely focus on Italy and the Euro on Tuesday.
**************************************************************************
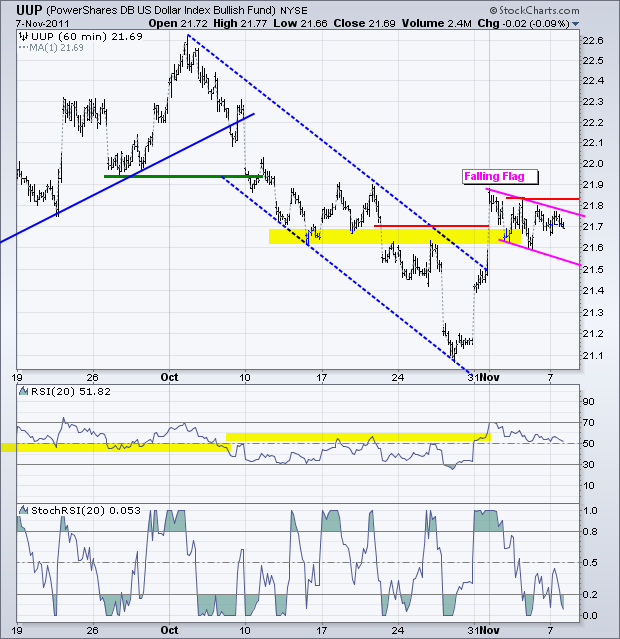
The US Dollar Fund (UUP) remains within a falling flag the last six days. This is a bullish continuation pattern. As with Treasuries, the big trend is up after the breakout surge. A break above flag resistance would signal a continuation of this breakout surge. At what point would this falling flag turn into a bigger downtrend? A break below 21.5 would skew the pattern and be bearish.
**************************************************************************
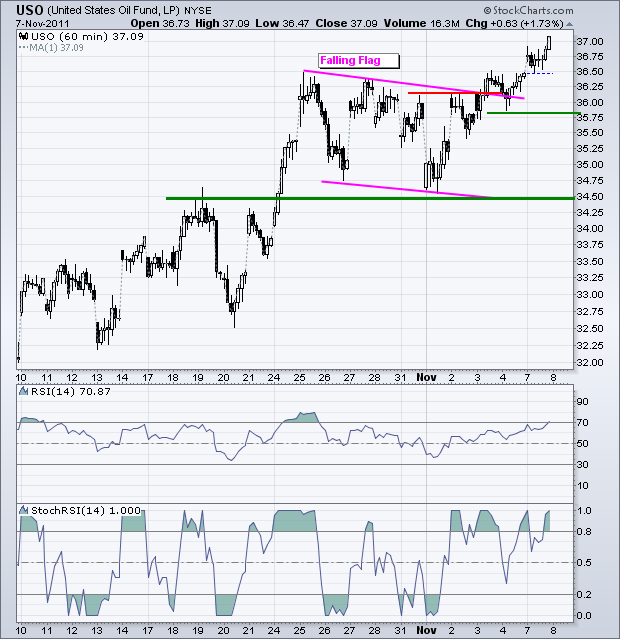
The US Oil Fund (USO) broke flag resistance with a move above 36.25 last week. The ETF finished strong on Friday and added to its gains on Monday. Oil is showing relative strength, relative to the stock market that is. This is a positive sign because it indicates strong demand for oil, which is indicative of a strengthening economy.
**************************************************************************
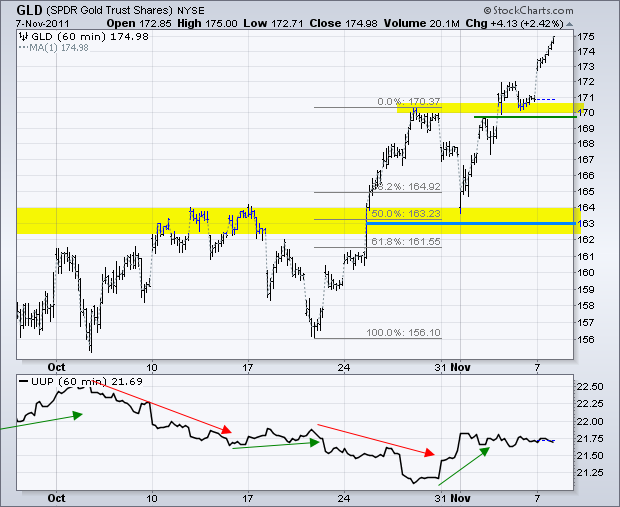
The Dollar is flat and gold has gone to the moon again. The Gold SPDR (GLD) broke resistance in late October, successfully tested broken resistance last week and continued higher the last five days. GLD is getting overbought, but showing no signs of weakness. Broken resistance in the 170 area turns into the first support zone to watch on any pullback.
**************************************************************************
Key Economic Reports:
Wed - Nov 09 - 07:00 - MBA Mortgage Index
Wed - Nov 09 - 10:00 - Wholesale Inventories
Wed - Nov 09 - 10:30 - Oil Inventories
Thu - Nov 10 - 08:30 - Jobless Claims
Fri - Nov 11 - 09:55 - Michigan Sentiment
Charts of Interest: Tuesday and Thursday in separate post.
This commentary and charts-of-interest are designed to stimulate thinking. This analysis is not a recommendation to buy, sell, hold or sell short any security (stock ETF or otherwise). We all need to think for ourselves when it comes to trading our own accounts. First, it is the only way to really learn. Second, we are the only ones responsible for our decisions. Think of these charts as food for further analysis. Before making a trade, it is important to have a plan. Plan the trade and trade the plan. Among other things, this includes setting a trigger level, a target area and a stop-loss level. It is also important to plan for three possible price movements: advance, decline or sideways. Have a plan for all three scenarios BEFORE making the trade. Consider possible holding times. And finally, look at overall market conditions and sector/industry performance.
