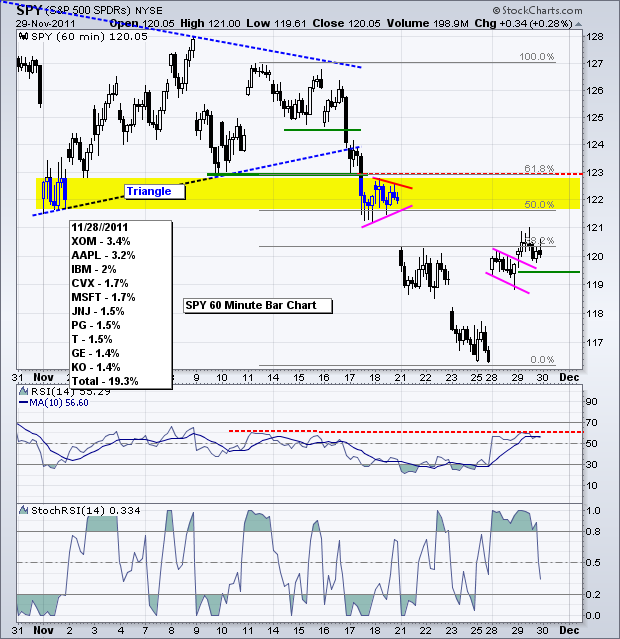
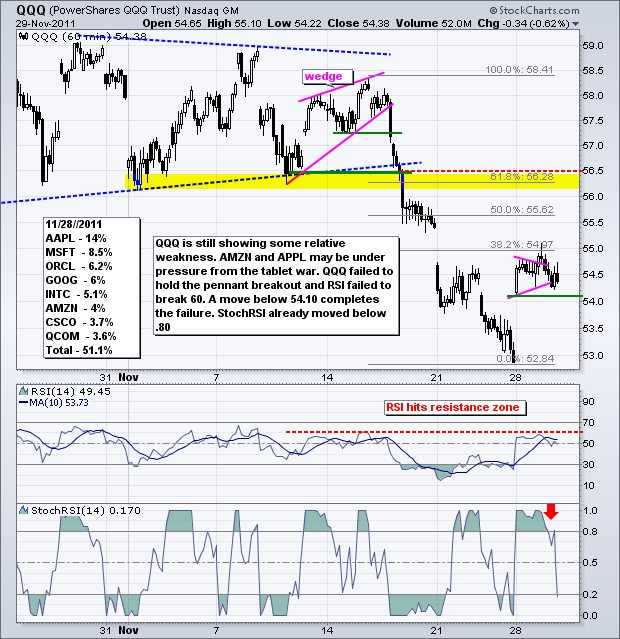
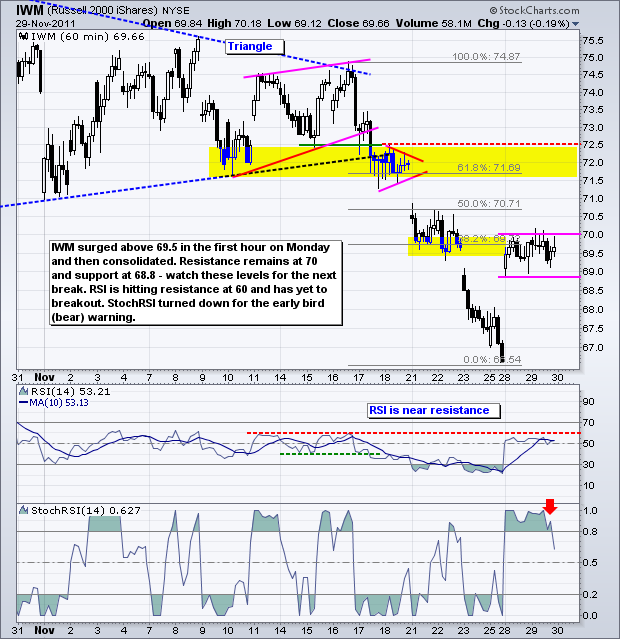
Guess what? Reports indicate that the Euro-zone bailout fund is smaller than EU finance ministers once thought. There is also a "secret" report suggesting that Italy is on the verge of blowing up the Euro zone. Yes, the rumors continue to fly. These latest rumors are putting a damper on stock futures and the Euro early Wednesday (5AM ET). In addition to the European issues, don't forget that it is a big week for US economic reports. Among others, we have the Fed's Beige Book on Wednesday, ISM Services on Thursday and the big Employment Report on Friday. Short-term traders will no doubt have plenty of volatility and excitement the next three days. It should be noted at the bigger trends for stocks and the Euro remain down. This means that any bounces are considered corrections within this bigger downtrend. On the price chart, SPY gapped up on Monday, formed a small falling flag and broke flag resistance early Tuesday. This breakout, provided it holds, is short-term bullish and targets a move to the next resistance zone in the 122-123 area. I am marking first support at 119.40. A move below this level would negate the breakout and put Monday's surge on notice. RSI surged to the 50-60 zone early Monday and did not break this resistance area to stay in bear mode. StochRSI moved below .80 to signal a short-term downturn in momentum. StochRSI, being the hyperactive oscillator that it is, can be used to identify short-term overbought conditions within a larger downtrend. A move back below .80 signals an end to these short-term overbought conditions and serves as the first bearish signal.
**************************************************************************
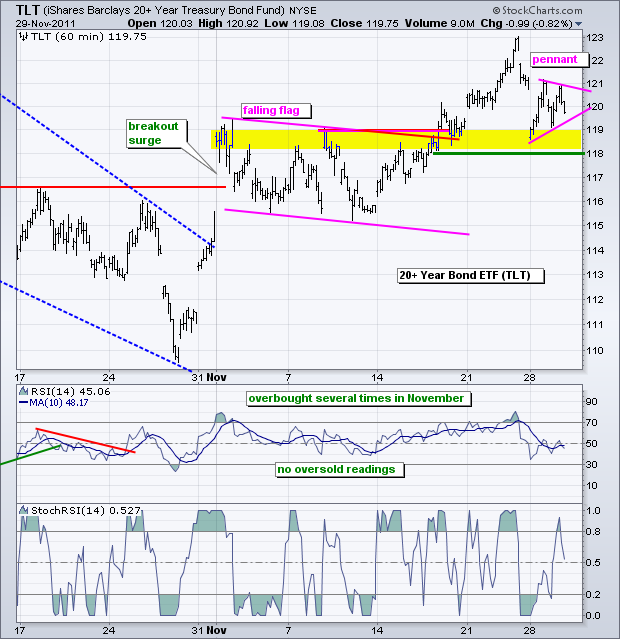
Treasuries will be in the spot light this week. First, they represent the safe-haven trade more than ever. German Bunds have fallen out of favor lately. Second, they will be reacting to the employment data over the next three days. Better-than-expected employment data would be positive for the economy and stock market, but negative for Treasuries. Worse-than-expected data would be positive for Treasuries. The 20+ year Bond ETF (TLT) is currently holding its flag breakout with support in the 118-119 area. A pennant has taken shape the last two days. A break below 119 would be the first bearish signal, while a break above 121 would be bullish.
**************************************************************************
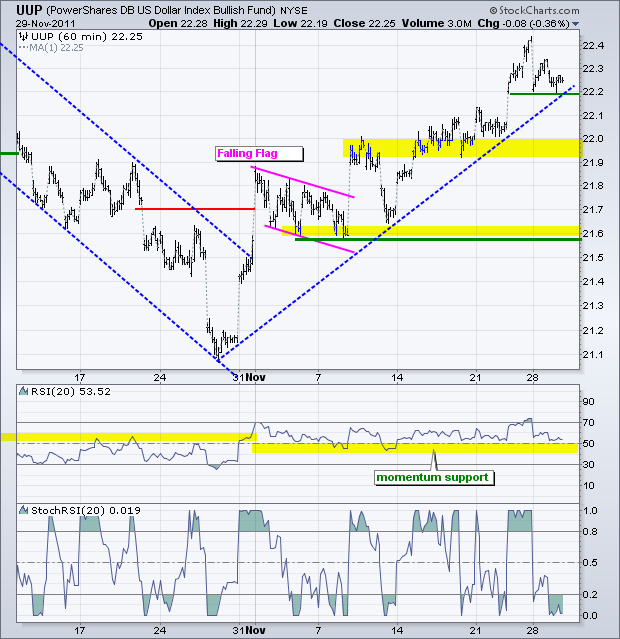
The US Dollar Fund (UUP) corrected over the last two days with a pullback to the 22.20 area. The overall trend is up for the greenback and down for the Euro. The 22.20 area is the first support level to watch. It is, however, minor support. A break would target a move to the next support zone around 21.9-22. RSI has support in the 50-60 zone.
**************************************************************************
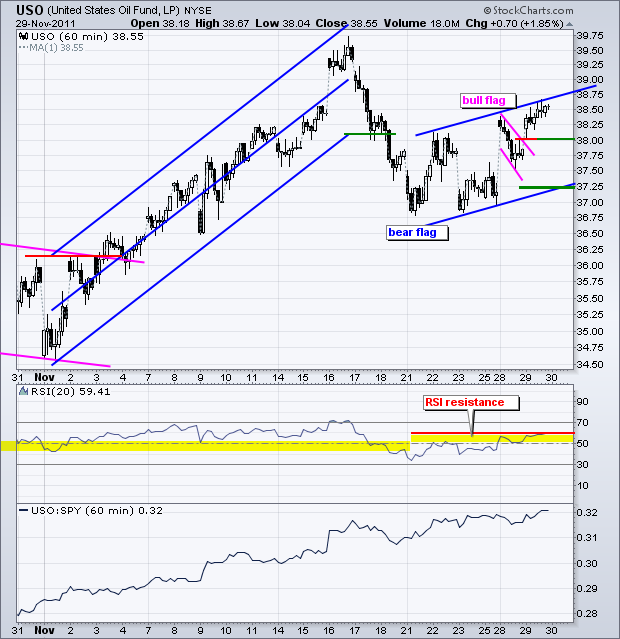
The US Oil Fund (USO) broke falling flag resistance with a surge above 38 in early trading. This breakout held as the ETF moved above Monday's high. Once again, oil continues to show more strength than the stock market. This flag breakout is bullish as long as it holds. A move below 38 would negate the breakout and put the bigger bear flag in play (blue lines). Bear flag support is set at 37.25. RSI is meeting resistance in the 50-60 zone and did not confirm the bull flag breakout.
**************************************************************************
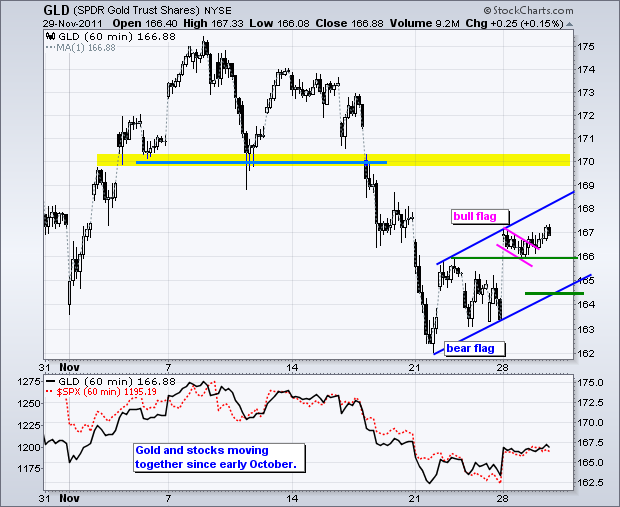
The patterns in the Gold SPDR (GLD) resemble those in USO above. Also note that gold continues to move step-for-step with the stock market. See the indicator window. SPY is in red and gold in black. GLD broke flag resistance with the move above 166.50 and I am setting first support at 166. A move below this level negates the flag breakout and puts the bigger bear flag in play. Bear flag support is set at 164.50.
**************************************************************************
Key Economic Reports:
Wed - Nov 30 - 07:00 - MBA Mortgage Index
Wed - Nov 30 - 07:30 - Challenger Job Cuts
Wed - Nov 30 - 08:15 - ADP Employment Report
Wed - Nov 30 - 09:45 - Chicago PMI
Wed - Nov 30 - 10:00 - Pending Home Sales
Wed - Nov 30 - 10:30 – Oil Inventories
Wed - Nov 30 - 14:00 - Fed's Beige Book
Thu - Dec 01 - 08:30 - Jobless Claims
Thu - Dec 01 - 10:00 - ISM Services Index
Thu - Dec 01 - 10:00 - Construction Spending
Thu - Dec 01 - 15:00 - Auto/Truck Sales
Fri - Dec 02 - 08:30 – Employment Report
Charts of Interest: Tuesday and Thursday in separate post.
This commentary and charts-of-interest are designed to stimulate thinking. This analysis is not a recommendation to buy, sell, hold or sell short any security (stock ETF or otherwise). We all need to think for ourselves when it comes to trading our own accounts. First, it is the only way to really learn. Second, we are the only ones responsible for our decisions. Think of these charts as food for further analysis. Before making a trade, it is important to have a plan. Plan the trade and trade the plan. Among other things, this includes setting a trigger level, a target area and a stop-loss level. It is also important to plan for three possible price movements: advance, decline or sideways. Have a plan for all three scenarios BEFORE making the trade. Consider possible holding times. And finally, look at overall market conditions and sector/industry performance.

