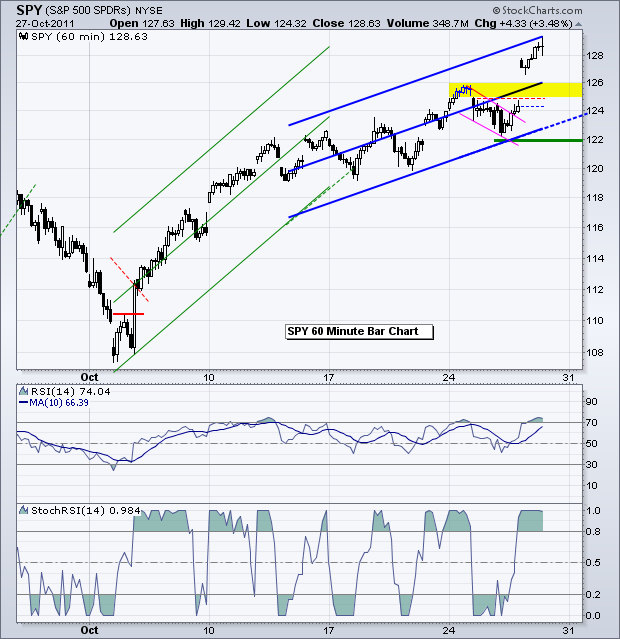
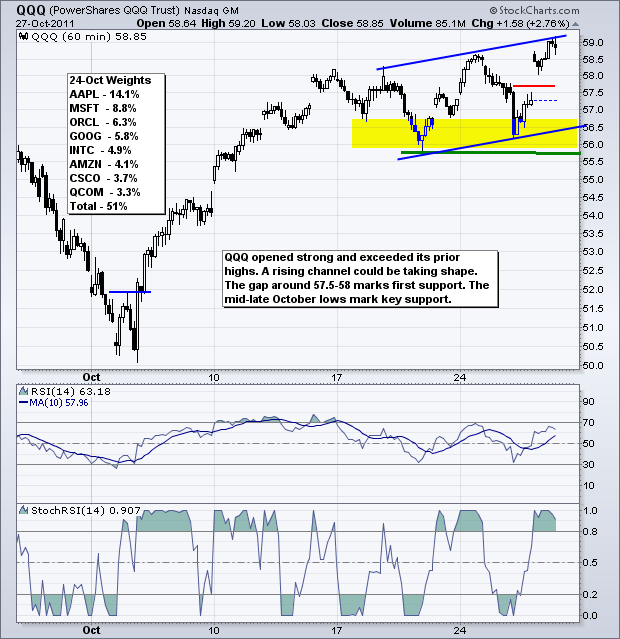
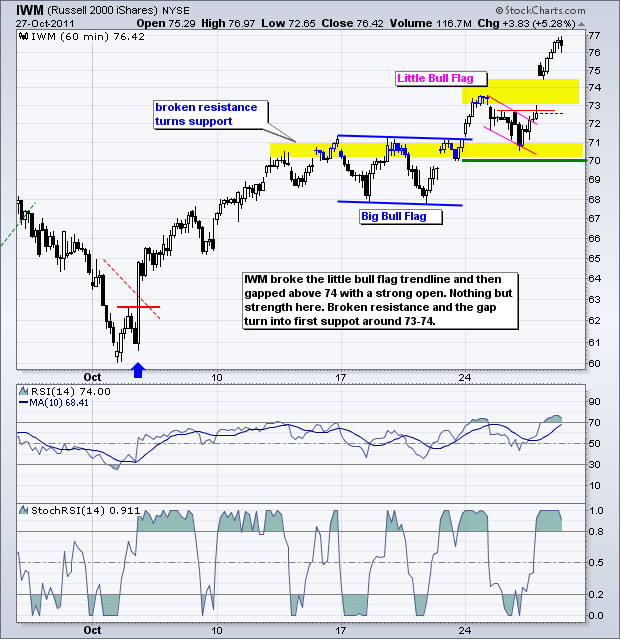
Stocks surged on the open and closed strong with all boats rising. Small-caps and mid-caps led the advance, which shows a strong appetite for risk. All sectors were up with the Finance SPDR (XLF) surging almost 6%. Whether short covering or new buying, Thursday's advance is setting the S&P 500 up for its best month since 1974. Who, who, who let the bulls out? I guess it was the EU and their bazooka. Thursday's advance marked an extension of uptrends that were in force since early October. There was a rest or consolidation period in the middle of the month and the uptrends resumed in force late last week. With massive moves the last five days, stocks are again short-term overbought. IWM is up over 11% since last Thursday and SPY is up around 5%. On the chart, SPY continues with its series of rising peaks and rising troughs. Broken resistance and the gap around 125-126 turn into the first support zone to watch. Key support remains at 122.
**************************************************************************
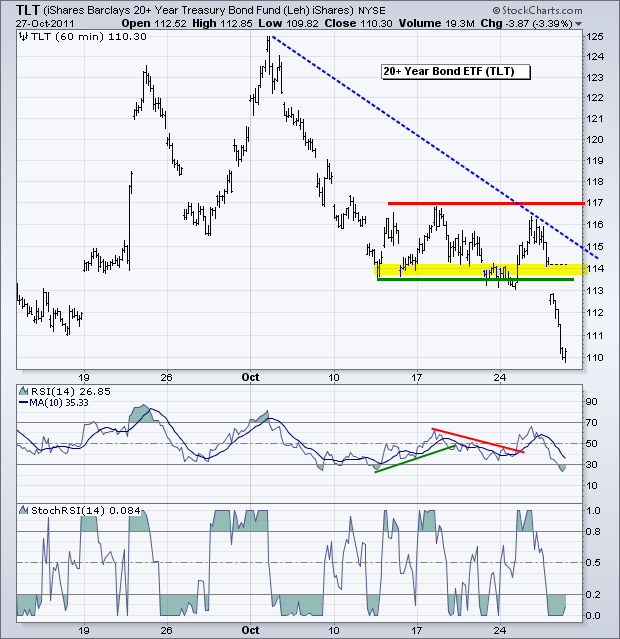
The 20+ year Bond ETF (TLT) took its cue from the EU deal, the Euro and Wall Street. First, there was a sharp decline in early October. Second, the ETF consolidated for two weeks. Third, the ETF continued lower with the break below 114. Money moving out of Treasuries (safety) found its way into riskier assets (stocks etc...). Broken support turns into the first resistance zone around 114.
**************************************************************************
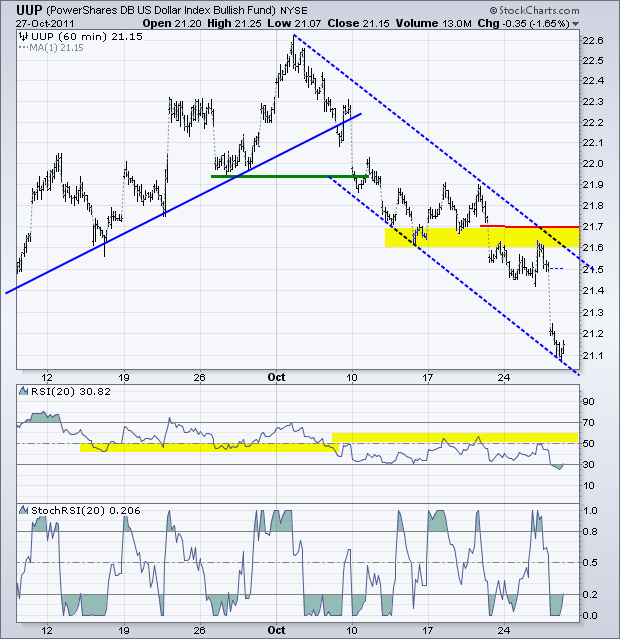
The US Dollar Fund (UUP) plunged as money moved into the Euro, which accounts for around 57% of the US Dollar Index. Forex traders decided that the Dollar is uglier than the Euro, for now. The short-term trend has been down since the early October breakdown. Notice how UUP is following the course of TLT. There was a sharp decline, consolidation and continuation lower. UUP, however, continued lower before TLT. Broken support turns into the first resistance zone in the 21.6 to 21.7 area.
**************************************************************************
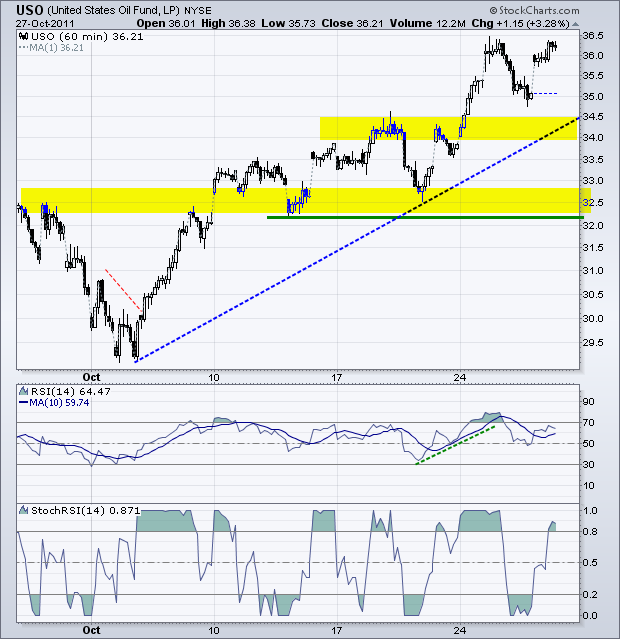
The US Oil Fund (USO) surged along with stocks and the Euro. It was a classic risk-on day. Oil was also helped by weakness in the Dollar. Broken resistance and the early October trendline turn into the first support zone in the 34-34.5 area.
**************************************************************************
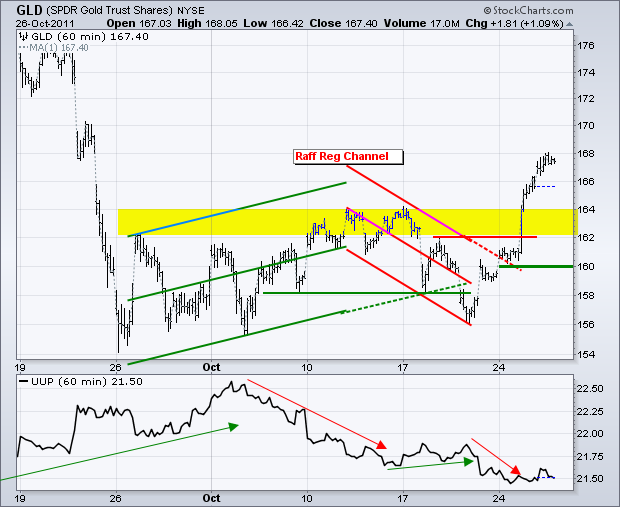
Gold is starting to get a mind of its own. Or, perhaps gold was anticipating the EU deal and the surge in the Euro. The Dollar peaked in early October and has been moving down the last four weeks. Gold bottomed in late September and has been moving higher the last five weeks. Hmmm....gold seems to be leading the Dollar. Whatever the reason, GLD broke resistance and broken resistance turns into the first support zone in the 162-164 area.
**************************************************************************
Key Economic Reports:
Fri - Oct 28 - 08:30 - Personal Income/Spending
Fri - Oct 28 - 09:55 - Michigan Sentiment
Charts of Interest: Tuesday and Thursday in separate post.
This commentary and charts-of-interest are designed to stimulate thinking. This analysis is not a recommendation to buy, sell, hold or sell short any security (stock ETF or otherwise). We all need to think for ourselves when it comes to trading our own accounts. First, it is the only way to really learn. Second, we are the only ones responsible for our decisions. Think of these charts as food for further analysis. Before making a trade, it is important to have a plan. Plan the trade and trade the plan. Among other things, this includes setting a trigger level, a target area and a stop-loss level. It is also important to plan for three possible price movements: advance, decline or sideways. Have a plan for all three scenarios BEFORE making the trade. Consider possible holding times. And finally, look at overall market conditions and sector/industry performance.

