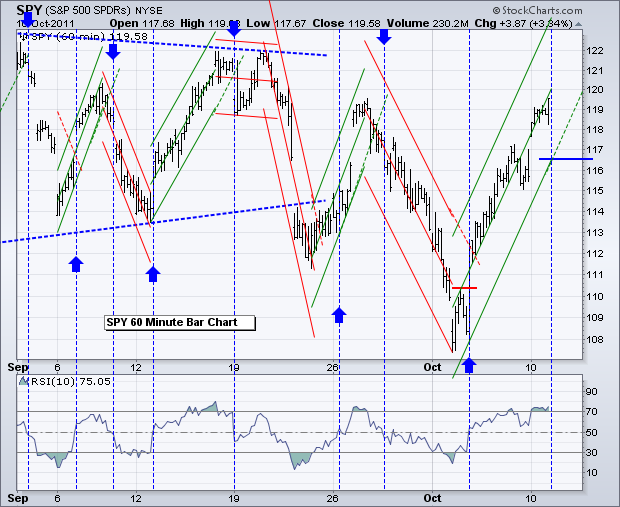
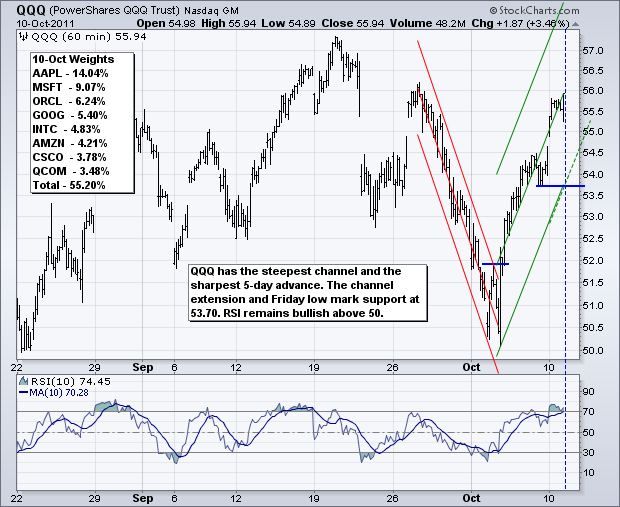
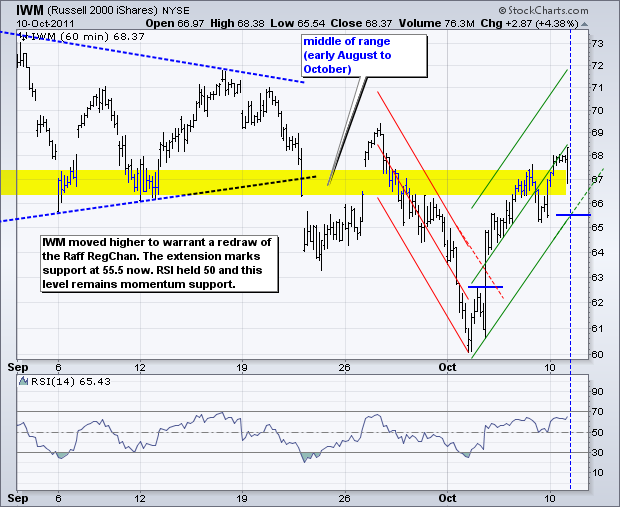
Stocks opened strong, remained strong and closed strong on Columbus Day. Unsurprisingly, volume was very light. This move keeps the short-term uptrends alive and allows for an extension of the rising channels. On the S&P 500 ETF (SPY) chart, the Raff Regression Channel can now be drawn from the October closing low to yesterday's closing high. The channel needs to be redrawn when SPY closes at a new high for the move. The lower channel trendline can now be extended to mark support. Current support is at 116.50 (blue line). The channel would require a redraw if SPY moves higher on Tuesday. The channel and extension will remain unchanged as long as the ETF does not close above yesterday's high. We are using 60-minute bar charts. This means each bar represents a closing price. Turning to the indicator window, RSI moved above 50 with the channel breakout last week and remains comfortably above 50. A move below 50 can be used to confirm a channel support break.
**************************************************************************
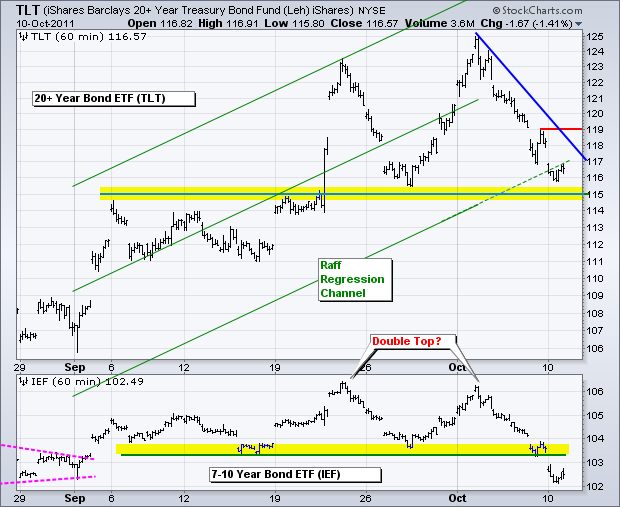
Bonds are unlikely to reverse unless stocks reverse their upswing. The 20+ year Bond ETF (TLT) has been moving lower since the Tuesday reversal and is now down around 8% from its high. There is, however, support at hand from broken resistance and the late September low (115 area). Downswing resistance is set at 119.
**************************************************************************
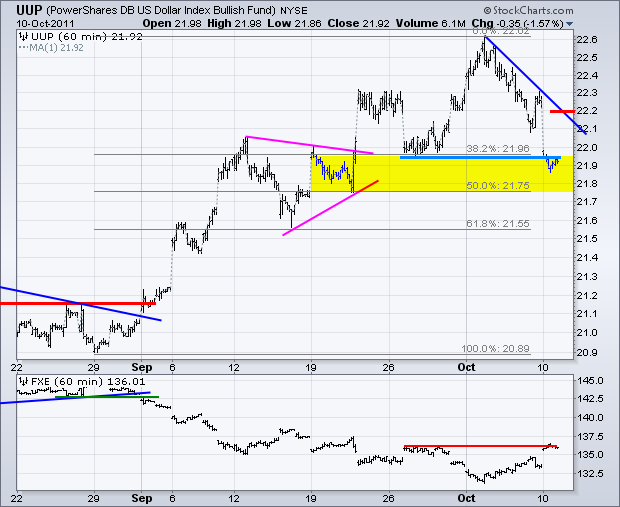
The US Dollar Fund (UUP) got whacked on news that Sarkozy and Merkel had a plan to think about a plan to solve the European debt issues once and for all. Never mind that the July plan on the EFSF has yet to get unanimous approval from all 17 member states. Malta just approved it and Slovakia begins debating today. Events are happening fast, but the politicians are moving slow. Talk about behind the curve. Slovakia will probably pass the resolution eventually and perhaps this is being priced into the Euro. UUP dropped sharply on Monday, but is in a support zone. Even though the ETF broke below the late September low, I see support somewhere around the 50% retracement mark (21.75). This decline is still considered a correction within a bigger uptrend. The current swing is down with support at 22.20.
**************************************************************************
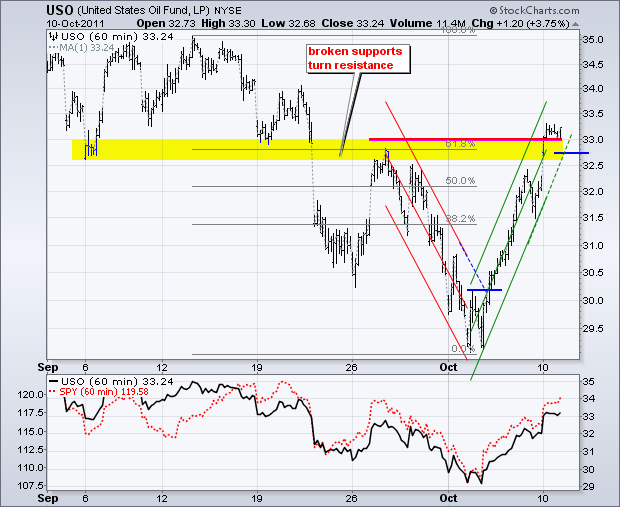
The US Oil Fund (USO) surged along with the stock market. Oil was also helped by a sharp decline in the Dollar. The ETF is now just above its resistance zone. I would not, however, consider this a breakout. It is more likely an overshoot. Zone is the key word here. Even though broken support and Fibonacci retracements can be pinpointed, markets are driven by emotions and often overshoot these zones. These zones are there to alert chartists of a potential reversal. An actual reversal is not confirmed until there is some sort of breakdown.
**************************************************************************
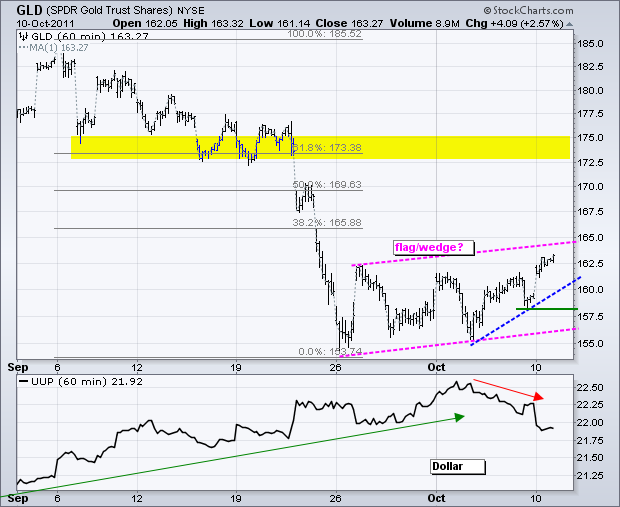
The Gold SPDR (GLD) surged above its late September and early October highs. The October trend is up, but I am concerned that a bearish flag/wedge could be taking shape. At the very least, yesterday's gains need to hold. A move below Friday's low would be quite negative and bring the flag/wedge to the forefront. Chartists should also watch the Dollar for clues on bullion.
**************************************************************************
Key Economic Reports:
Tue - Oct 11 - 14:00 - FOMC Minutes
Wed - Oct 12 - 07:00 - MBA Mortgage Index
Thu - Oct 13 - 08:30 - Jobless Claims
Thu - Oct 13 - 11:00 - Oil Inventories
Fri - Oct 14 - 08:30 - Retail Sales
Fri - Oct 14 - 09:55 - Michigan Sentiment
Fri - Oct 14 - 10:00 - Business Inventories
Sun – Oct 17 – 10:00 – European Debt Summit
Charts of Interest: Tuesday and Thursday in separate post.
This commentary and charts-of-interest are designed to stimulate thinking. This analysis is not a recommendation to buy, sell, hold or sell short any security (stock ETF or otherwise). We all need to think for ourselves when it comes to trading our own accounts. First, it is the only way to really learn. Second, we are the only ones responsible for our decisions. Think of these charts as food for further analysis. Before making a trade, it is important to have a plan. Plan the trade and trade the plan. Among other things, this includes setting a trigger level, a target area and a stop-loss level. It is also important to plan for three possible price movements: advance, decline or sideways. Have a plan for all three scenarios BEFORE making the trade. Consider possible holding times. And finally, look at overall market conditions and sector/industry performance.

