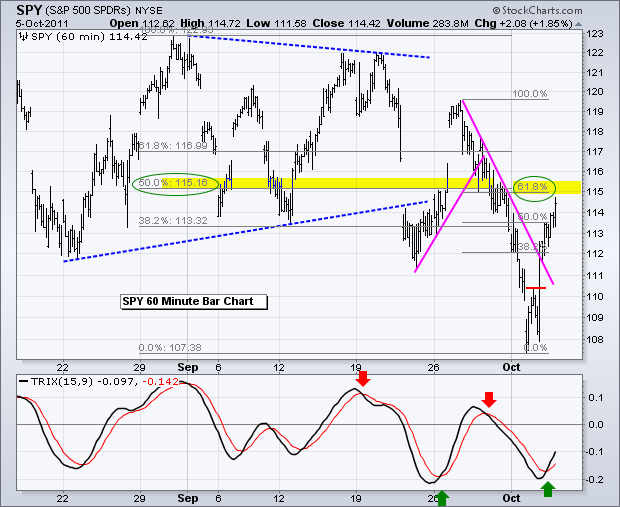
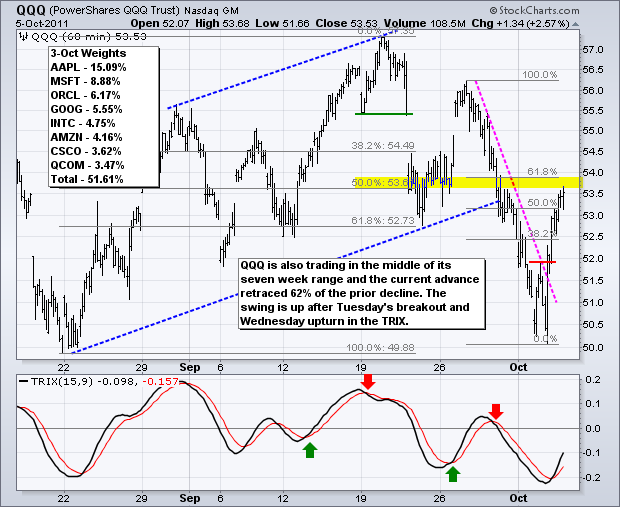
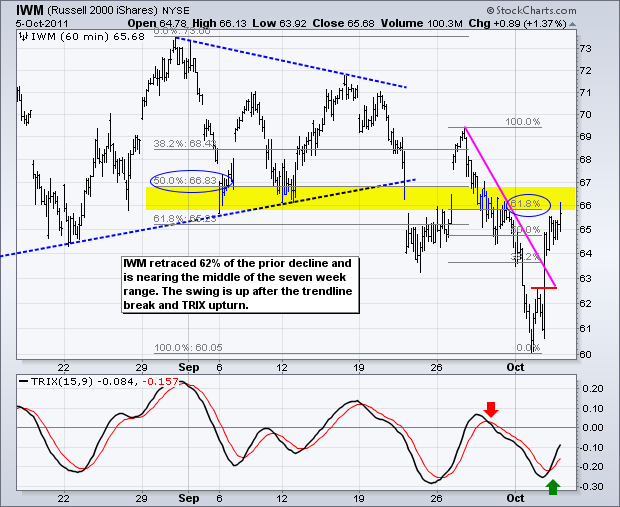
The current upswing continued as stocks added to Tuesday's gains. All major index ETFs were up over 1%, but the Russell 2000 ETF (IWM) lagged with the smallest gain. Unsurprisingly, the Nasdaq 100 ETF (QQQ) led the way higher with a 2.57% gain. Big techs continue to show relative strength. While these stocks are still exposed to the business cycle, many of these companies are sitting lots of cash and have solid businesses. Wednesday's market leaders included Dell (DELL), Intel (INTC), Microsoft (MSFT), Oracle (ORCL) and F5 Networks (FFIV). While the gains of the last one day 50 minutes are impressive, traders can now look forward to Friday morning's employment report. Also note that the European Central Bank (ECB) will make its rate decision at 8:45AM ET and hold a press conference at 9:30AM ET. While I do not expect another big bailout/stimulus announcement, you never know what could come out of Europe these days.
SPY is now trading in the middle of its seven week range (±108 to 123). Also note that the current bounce has retraced 61.80% of the prior decline. Yesterday's bounce pushed the ETF above the broken support zone and these Fibonacci Retracements Tools mark another potential support zone around 115. We can only go with zones when volatility is so high. Prices could easily go either way with the ETF in the middle of its range and news flow on Thursday-Friday would influence short-term trading. Technically, the current swing is up after Tuesday's trendline break and the TRIX upturn on Wednesday. Marking upswing support is difficult because the surge is so sharp.
**************************************************************************
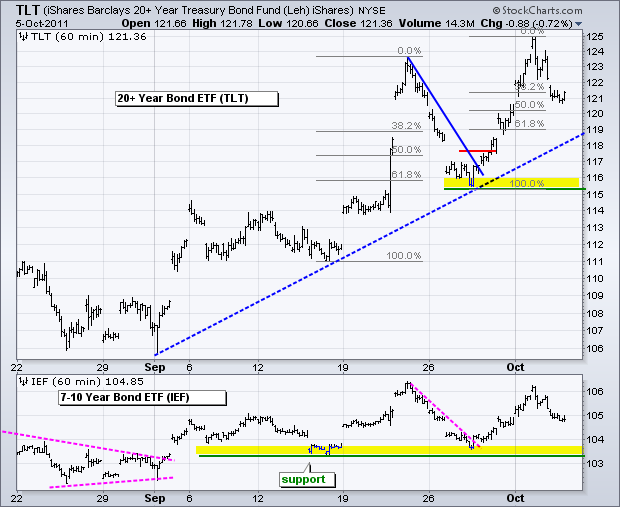
The 20+ year Bond ETF (TLT) will eagerly await the employment report. A better-than-expected report would put downward pressure on bonds, while a worse-than-expected report would be bullish for bonds. TLT remains in an uptrend overall. The pullback over the last few days retraced 38-50% of the most recent surge. Another potential support zone resides in the 119 area. This is marked by the 61.80% retracement and September trendline.
**************************************************************************
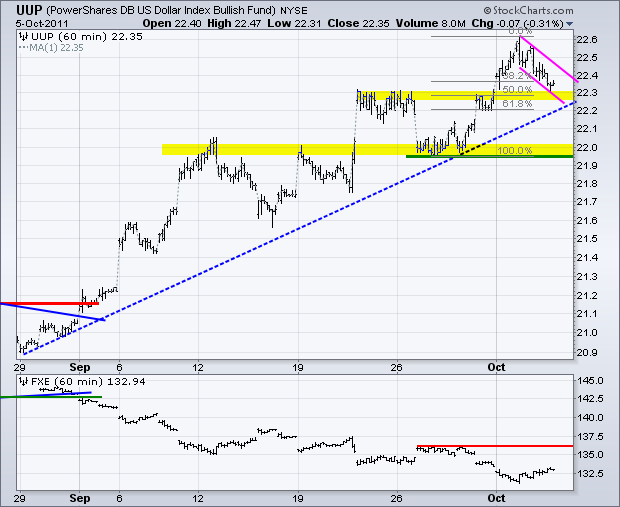
The US Dollar Fund (UUP) pulled back with a falling flag taking shape the last few days. The flag retraced 50% of the prior surge. There is also potential support in the 22.3 area from broken resistance. Also note that the late August trendline comes into play soon. The Euro will be affected by the European Central Bank (ECB) rate decision this morning. A dovish tone would be negative for the Euro, while continued hawkishness would be Euro positive.
**************************************************************************
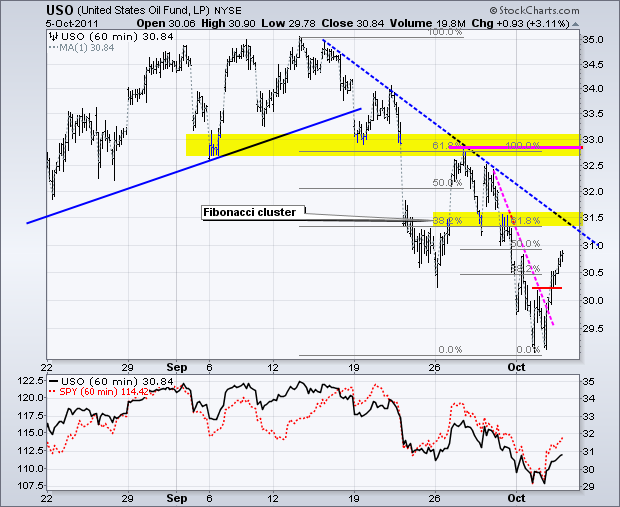
The US Oil Fund (USO) moved higher along with the stock market over the last two days. The ETF broke short-term resistance and started an upswing on Wednesday. Based on the Sep-Oct decline and the decline of the past week, there is a Fibonacci cluster around 31.50 that may mark next resistance. The mid September trendline also extends to this area.
**************************************************************************
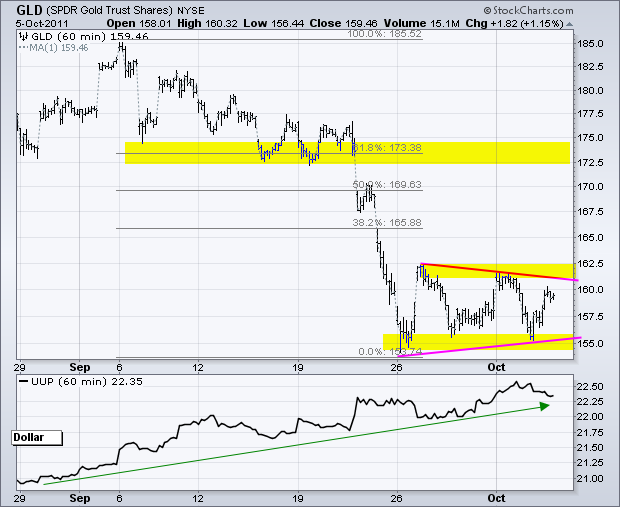
The Gold SPDR (GLD) firmed over the last 10 days with a triangle taking shape. Triangles within downtrends are considered bearish continuation patterns. However, the direction bias comes from the break. A downside break at 155 would be bearish, but an upside break at 162.5 would be bullish and argue for a move to the next resistance zone. Despite some distance late last week, Gold seems to still be fixated on the Dollar. A breakout in the Dollar would likely be negative for gold.
**************************************************************************
Key Economic Reports:
Thu - Oct 06 - 09:30 – European Central Bank (ECB) Policy Statement
Thu - Oct 06 - 08:30 - Jobless Claims
Fri - Oct 07 - 08:30 - Employment Reprot
Fri - Oct 07 - 15:00 - Consumer Credit
Charts of Interest: Tuesday and Thursday in separate post.
This commentary and charts-of-interest are designed to stimulate thinking. This analysis is not a recommendation to buy, sell, hold or sell short any security (stock ETF or otherwise). We all need to think for ourselves when it comes to trading our own accounts. First, it is the only way to really learn. Second, we are the only ones responsible for our decisions. Think of these charts as food for further analysis. Before making a trade, it is important to have a plan. Plan the trade and trade the plan. Among other things, this includes setting a trigger level, a target area and a stop-loss level. It is also important to plan for three possible price movements: advance, decline or sideways. Have a plan for all three scenarios BEFORE making the trade. Consider possible holding times. And finally, look at overall market conditions and sector/industry performance.

