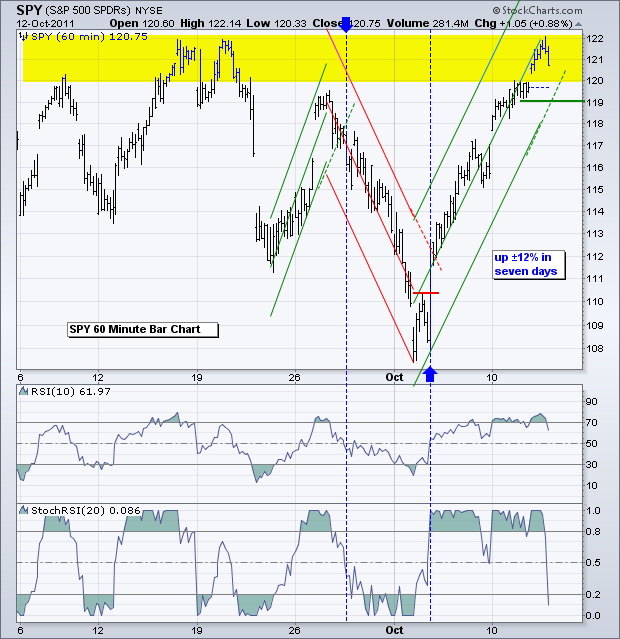
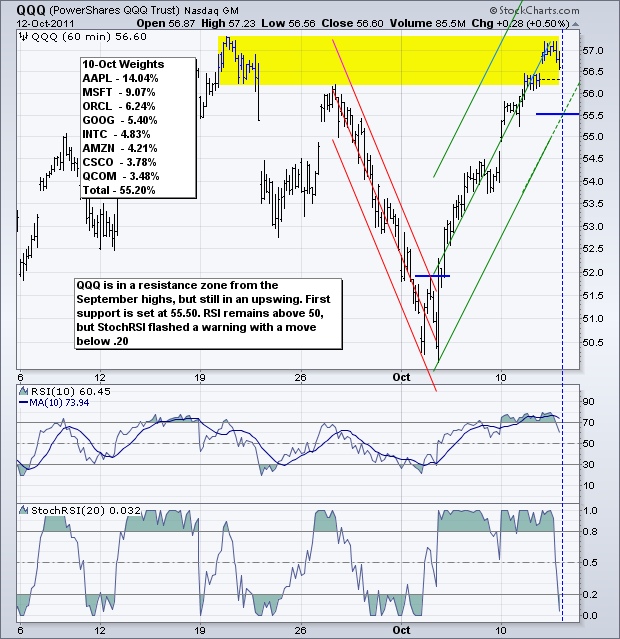
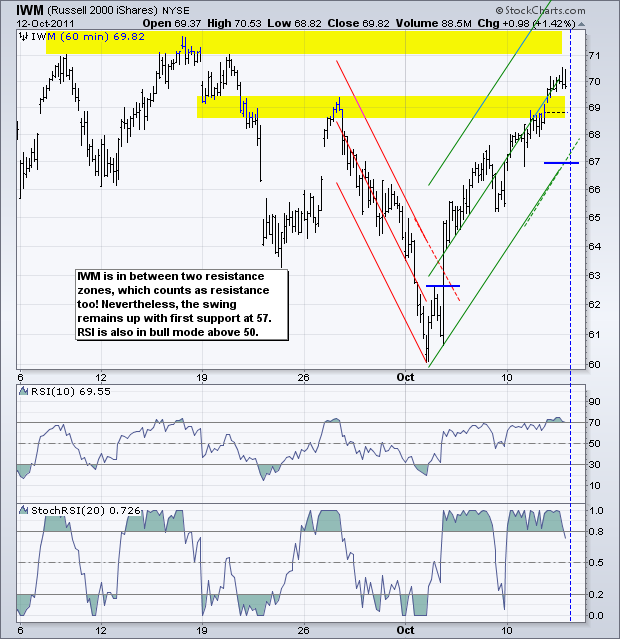
Stocks started the day with a bang, kept their gains most of the day and then sold off in the afternoon. With the S&P 500 ETF (SPY) up some 12% in seven days, the market is pricing in some pretty good news or some better-than-expected earnings reports. With stocks overbought and the major index ETFs at resistance zones, failure to deliver could weigh on the market. At the very least, stocks are ripe for some sort of pullback or consolidation. SPY gapped above 120 on the open, surged above 122 in the afternoon and then closed below 121. Resistance in the 120-122 area stems from the September highs, all three of them. The Raff Regression Channel extended further and I am now marking first support at 119. A move below this level would fill the gap, break the extension trendline and break support from Tuesday afternoon. Also watch RSI(10) for a break below 50 to confirm.
**************************************************************************
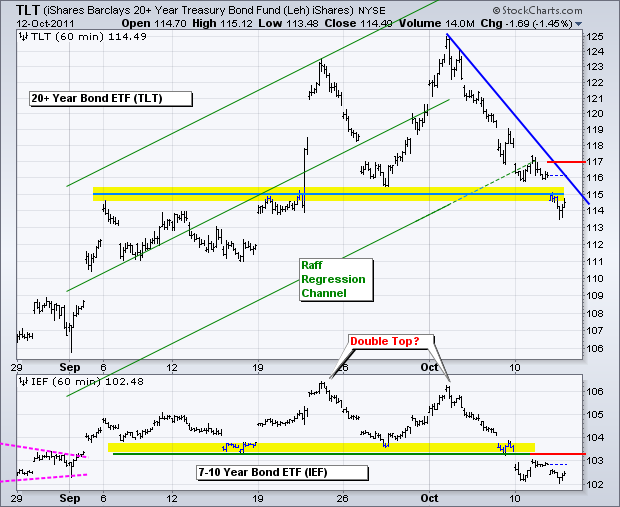
The 20+ year Bond ETF (TLT) continued lower as stocks and the Euro surged on Wednesday. Treasuries are unlikely to reverse as long as these two remain strong. The swing in TLT is down with resistance marked at 117.
**************************************************************************
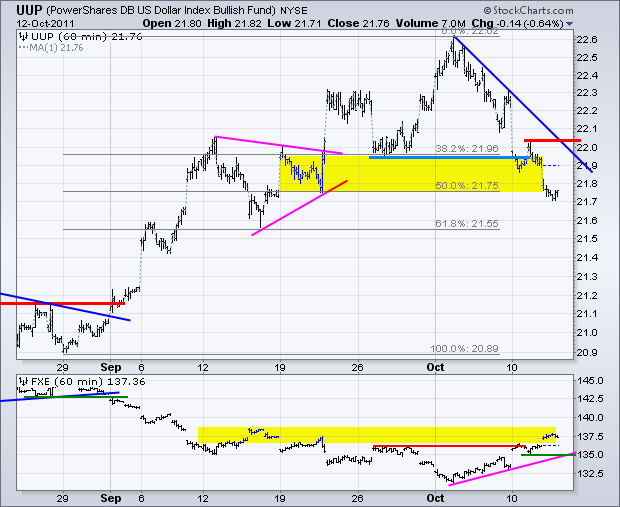
I keep identifying support levels for the Dollar and Treasuries, but these supports continue to be violated as the downswing extends. The opposite is true for stocks. Resistance levels are there, but the upswing simply extends. Support and resistance are secondary to the direction of the swing. They become valid when the swing reverses and can then be used to set stops. Downswing resistance for UUP is marked at 22.05.
**************************************************************************
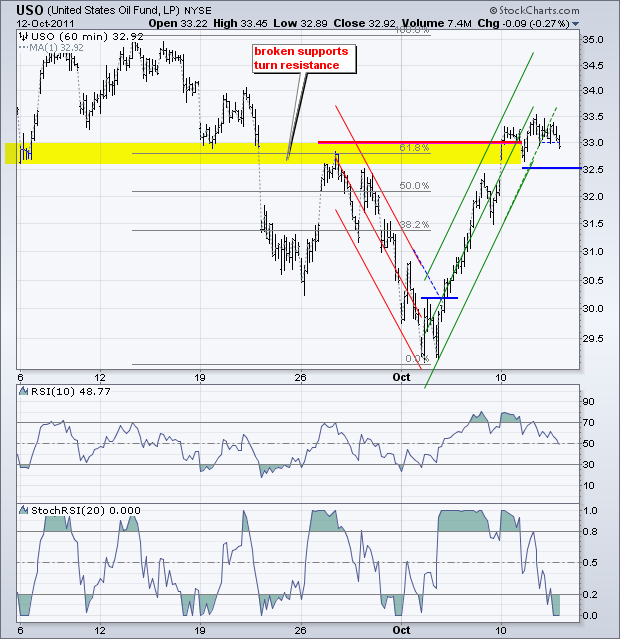
The US Oil Fund (USO) moved lower and did not partake in the risk-on trade Wednesday. USO broke the Raff Regression Channel extension and 20-period StochRSI moved below .20 to flash a warning. However, stocks have yet to confirm and first support at 32.50 has yet to be broken. Watch this level for confirmation.
**************************************************************************
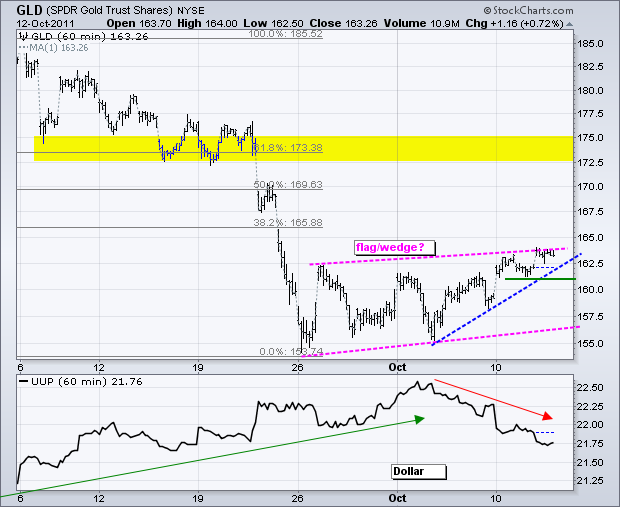
The Gold SPDR (GLD) has been moving higher since last week. Weakness in the Dollar is helping gold so chartists should keep an second eye on the greenback. There are two trends at work. A larger uptrend is defined by the rising flag/wedge with support at 155. Withtin the flag/wedge, the swing is up with support at 161.
**************************************************************************
Key Economic Reports:
Wed - Oct 12 - 07:00 - MBA Mortgage Index
Thu - Oct 13 - 08:30 - Jobless Claims
Thu - Oct 13 - 11:00 - Oil Inventories
Fri - Oct 14 - 08:30 - Retail Sales
Fri - Oct 14 - 09:55 - Michigan Sentiment
Fri - Oct 14 - 10:00 - Business Inventories
Sun – Oct 17 – 10:00 – European Debt Summit
Charts of Interest: Tuesday and Thursday in separate post.
This commentary and charts-of-interest are designed to stimulate thinking. This analysis is not a recommendation to buy, sell, hold or sell short any security (stock ETF or otherwise). We all need to think for ourselves when it comes to trading our own accounts. First, it is the only way to really learn. Second, we are the only ones responsible for our decisions. Think of these charts as food for further analysis. Before making a trade, it is important to have a plan. Plan the trade and trade the plan. Among other things, this includes setting a trigger level, a target area and a stop-loss level. It is also important to plan for three possible price movements: advance, decline or sideways. Have a plan for all three scenarios BEFORE making the trade. Consider possible holding times. And finally, look at overall market conditions and sector/industry performance.

