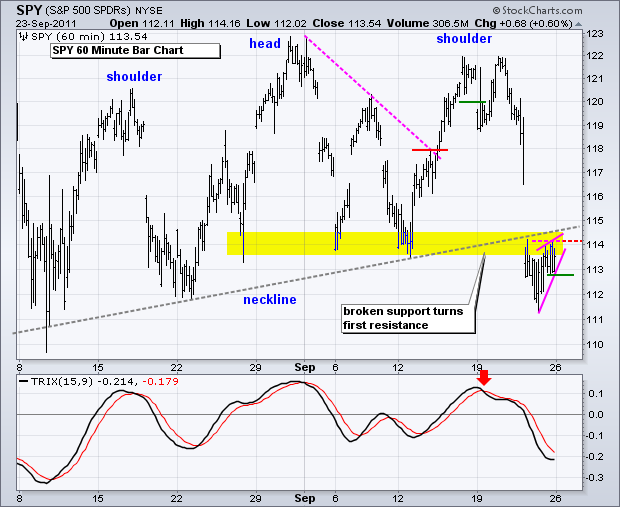
After a broad decline last week, stocks became short-term oversold and consolidated most of Thursday and Friday. This does nothing to change the short-term or medium-term downtrends. Overall, the medium-term trend is clearly down after a break below the September lows. For SPY, this area also marked neckline support for a continuation Head-and-Shoulders pattern (60 min chart) or a rising flag (weekly chart). It all depends on the drawing of the trendlines. Regardless of interpretation, both patterns are bearish continuation patterns. The height of the Head-and-Shoulders pattern (123 – 114 = 9) is subtracted from the neckline for a downside target (114 – 9 = 105).


**************************************************************************
The 20+ year Bond ETF (TLT) is probably the most overextended of all. TLT is up over 10% this month (low to high) and up over 30% since early July. These are emerging market kind of returns. Such unbridled strength in bonds defines the current risk-off environment. Broken resistance turns turns first support in the 114-115 area. Key support is set in the 111-112 area.

**************************************************************************
The US Dollar Fund (UUP) is as overbought as the S&P 500 ETF (SPY) is oversold. The trend is clearly up, but overbought conditions could lead to a consolidation or even a pullback. Broken resistance turns first support in the 21.9-22 area. Key support remains in the 21.6 area.

**************************************************************************
The US Oil Fund (USO) is going along with the stock market, down. USO broke wedge support and moved sharply lower late last week. Broken support around 32.75 turns into the first resistance zone for this oversold commodity ETF.

**************************************************************************
The Gold SPDR (GLD) is now down around 14% from its early September high and way oversold. This could pave the way for a consolidation or an oversold bounce. Deep corrections in gold are not uncommon. There were at least four 14+ percent declines from 2006 to 2010. Chartists can apply the zigzag indicator (14) to a daily chart to see movements that are at least 14%. This still looks like a correction within a long-term uptrend, but it is certainly one heck of a correction.

**************************************************************************
Key Economic Reports:
Mon - Sep 26 - 10:00 - New Home Sales
Tue - Sep 27 - 09:00 - Case-Shiller Housing Index
Tue - Sep 27 - 10:00 - Consumer Confidence
Wed - Sep 28 - 08:30 - Durable Orders
Wed - Sep 28 - 10:30 - Crude Inventories
Thu - Sep 29 - 08:30 - Initial Claims
Thu - Sep 29 - 08:30 - GDP
Thu - Sep 29 - 10:00 - Pending Home Sales
Fri - Sep 30 - 08:30 - Personal Income & Spending
Fri - Sep 30 - 09:45 - Chicago PMI
Fri - Sep 30 - 09:55 - Michigan Sentiment
Charts of Interest: Tuesday and Thursday in separate post.
This commentary and charts-of-interest are designed to stimulate thinking. This analysis is not a recommendation to buy, sell, hold or sell short any security (stock ETF or otherwise). We all need to think for ourselves when it comes to trading our own accounts. First, it is the only way to really learn. Second, we are the only ones responsible for our decisions. Think of these charts as food for further analysis. Before making a trade, it is important to have a plan. Plan the trade and trade the plan. Among other things, this includes setting a trigger level, a target area and a stop-loss level. It is also important to plan for three possible price movements: advance, decline or sideways. Have a plan for all three scenarios BEFORE making the trade. Consider possible holding times. And finally, look at overall market conditions and sector/industry performance.

