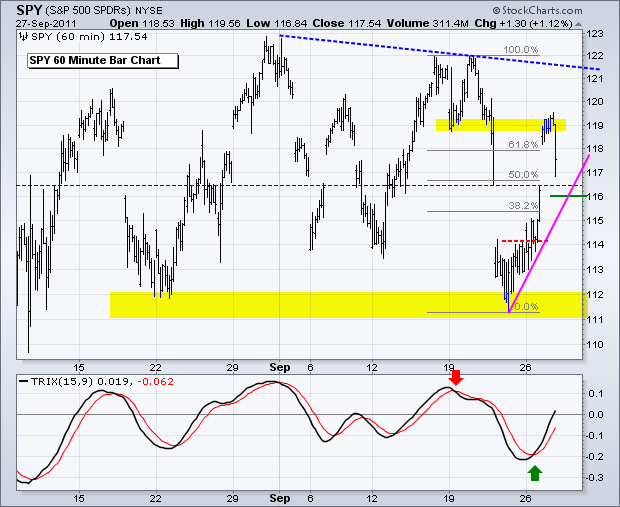
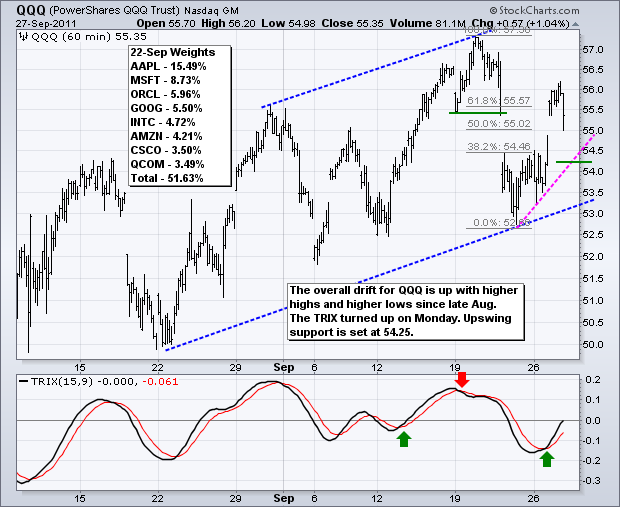
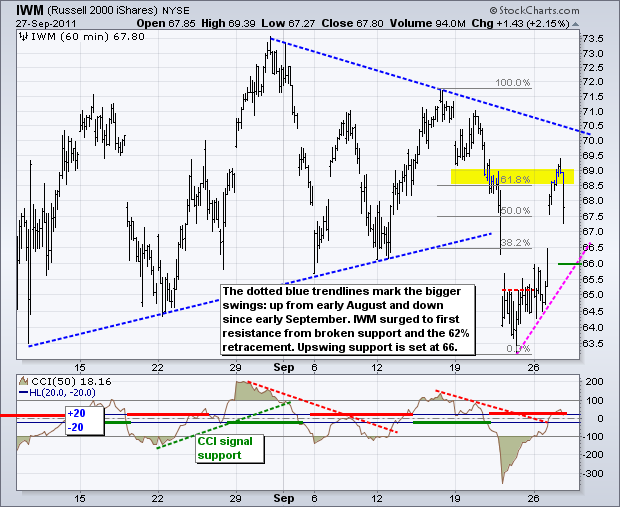
What a mess. The S&P 500 ETF (SPY) has been trading between 110 and 123 since early August (seven weeks). During this timeframe, the ETF has crossed the midpoint (116.50) at least 11 times. There have also been nine swings of at least five percent. This is more than one swing per week! Such a volatile consolidation is not enough to affect medium-term trend, which is down after the August breakdown. However, it is producing sizable short-term swings. The only way to make money short-term is to buy immediately after the upturn and sell the immediately after the downturn. Sometimes chartists can use a trendline or support/resistance level to identify a short-term reversal. Except for the quick whipsaw in early September, the TRIX oscillator has actually worked fairly well to identify the upturns and downturns. This oscillator is currently moving up to define the current upswing. On the price chart, the ETF met resistance near broken support around 119 and declined sharply the last hour. Based on the pink trendline and gap, I am marking upswing support at 116. Also notice that the overall drift is still down after SPY formed a lower high at 122 last week and a lower low below 112. It is a volatile drift though.
**************************************************************************
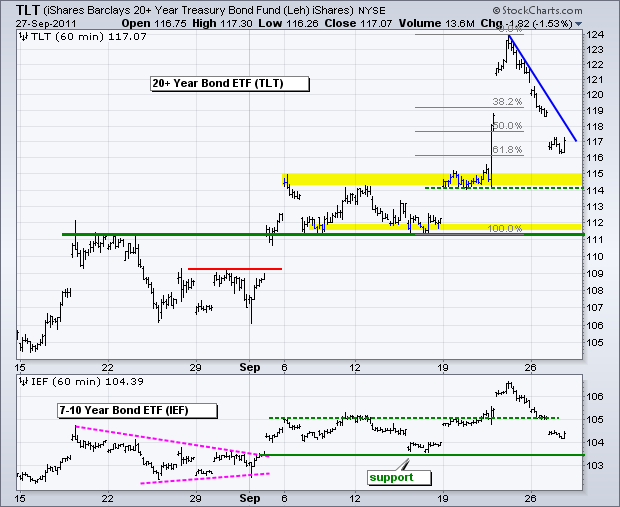
The 20+ year Bond ETF (TLT) is pretty much dependent on the stock market and the Euro. Strength in both favors the risk-on trade, which disfavors bonds. TLT corrected with a decline that retraced 61.80% of last week's surge. This decline is rather sharp and defined by the blue trendline. A surge above 118 would break this trendline and argue for a short-term trend reversal. Barring a trendline break, broken resistance marks the next support level in the 114-115 area.
**************************************************************************
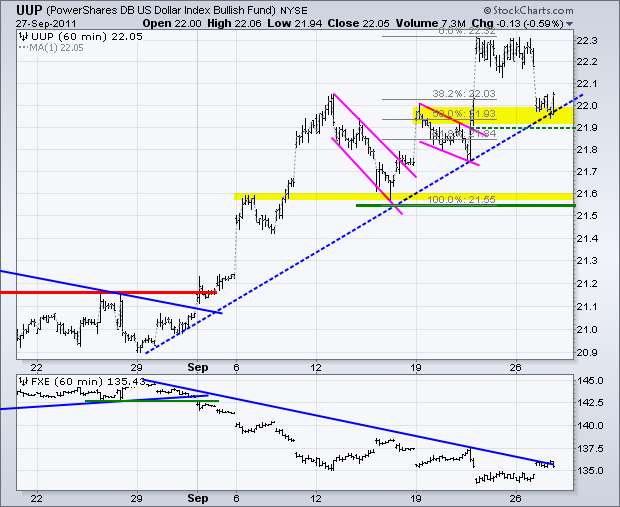
The US Dollar Fund (UUP) dropped with a decline to first support in the 21.9-22 area. Support here stems from broken resistance and the late August trendline. This area also marks a 50% retracement of the prior surge. The challenge here is that a falling flag or tradable pattern has not taken shape. Falling flag breakouts marked the last two signals. This week's news flow is getting better out of Europe, but the European Central Bank (ECB) meets next week (Oct 6th) for its policy statement. Economic weakness and a fragile financial system could give way to a rate cut that would further weigh on the Euro (benefit the Dollar). Don't forget that Europe would like to see a weaker Euro. Germany is a big exporter and its products become more competitive with a weaker Euro.
**************************************************************************
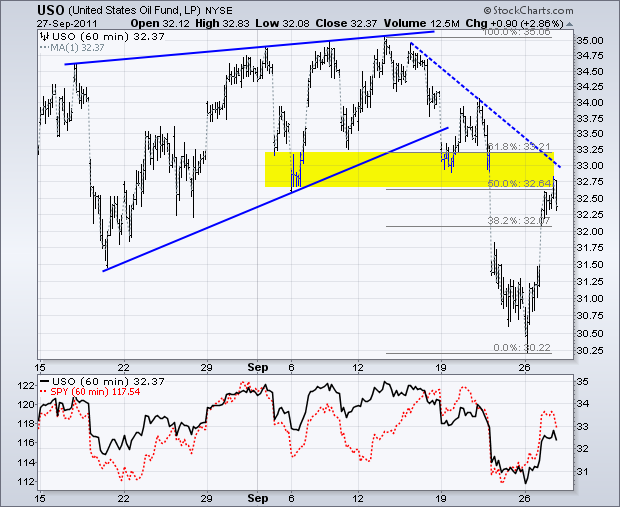
The US Oil Fund (USO) surged along with the stock market and the Euro. However, the bigger trend remains down and the ETF is nearing first resistance. Broken supports and the 50-61.80% retracement zone combine to mark resistance in the 33 area.
**************************************************************************
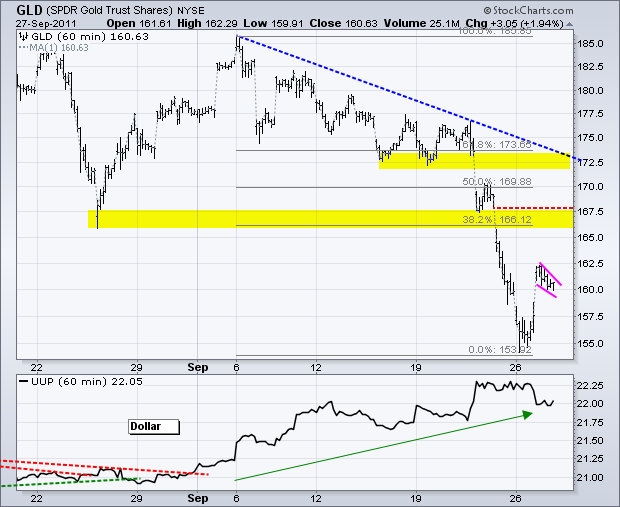
The Gold SPDR (GLD) got a big oversold bounce as the Dollar corrected. The ETF surged above 162 and then formed a small falling wedge. A break above wedge resistance would signal a continuation higher and target a move to broken support in the 166-167 area. This area also marks a 38.2% of the September decline.
**************************************************************************
Key Economic Reports:
Wed - Sep 28 - 08:30 - Durable Orders
Wed - Sep 28 - 10:30 - Crude Inventories
Thu - Sep 29 - 08:30 - Initial Claims
Thu - Sep 29 - 08:30 - GDP
Thu - Sep 29 - 10:00 - Pending Home Sales
Thu - Sep 29 - 10:00 – German Parliament vote on EFSF
Fri - Sep 30 - 08:30 - Personal Income & Spending
Fri - Sep 30 - 09:45 - Chicago PMI
Fri - Sep 30 - 09:55 - Michigan Sentiment
Charts of Interest: Tuesday and Thursday in separate post.
This commentary and charts-of-interest are designed to stimulate thinking. This analysis is not a recommendation to buy, sell, hold or sell short any security (stock ETF or otherwise). We all need to think for ourselves when it comes to trading our own accounts. First, it is the only way to really learn. Second, we are the only ones responsible for our decisions. Think of these charts as food for further analysis. Before making a trade, it is important to have a plan. Plan the trade and trade the plan. Among other things, this includes setting a trigger level, a target area and a stop-loss level. It is also important to plan for three possible price movements: advance, decline or sideways. Have a plan for all three scenarios BEFORE making the trade. Consider possible holding times. And finally, look at overall market conditions and sector/industry performance.
