The market is getting knee-deep in hollow rhetoric. Yesterday, Sarkozy and Merkel said they are "convinced that the future of Greece is in the euro zone". Gee, what a surprise. Chinese Premier Wen Jiabao stated that China will do everything in its power to preserve the Euro and that Europe was too big to fail. These are big grandiose statements without any details, but they seem to be putting a floor on the Euro, at least for now. In addition, we have seen a bid come into European and US stocks. European stocks were extremely oversold and ripe for a bounce or consolidation. US stocks bounced the last three days, but have been going nowhere since August 9th. The short-term trends are whipping back and forth, but the long-term trends remain down. I still view price action since August 8th as a corrective and not impulsive. The August decline and support break were impulse moves that started a bigger downtrend. Price action since August 8th looks corrective, which means the bigger downtrend will prevail at some point.
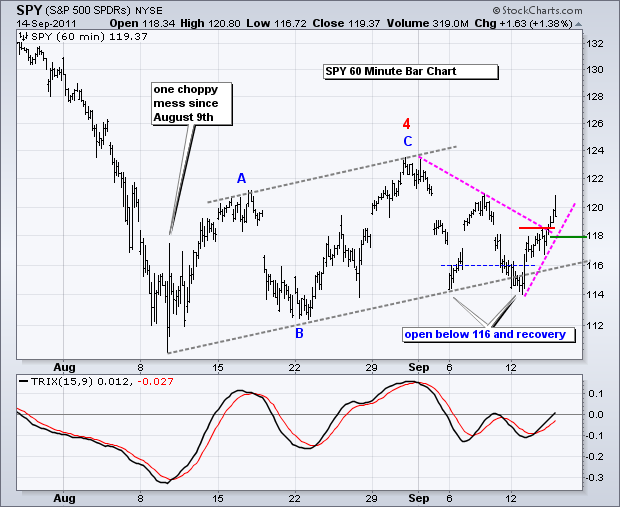
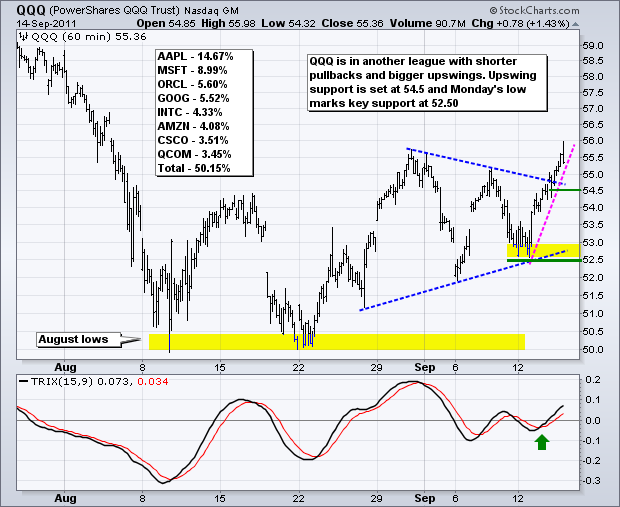
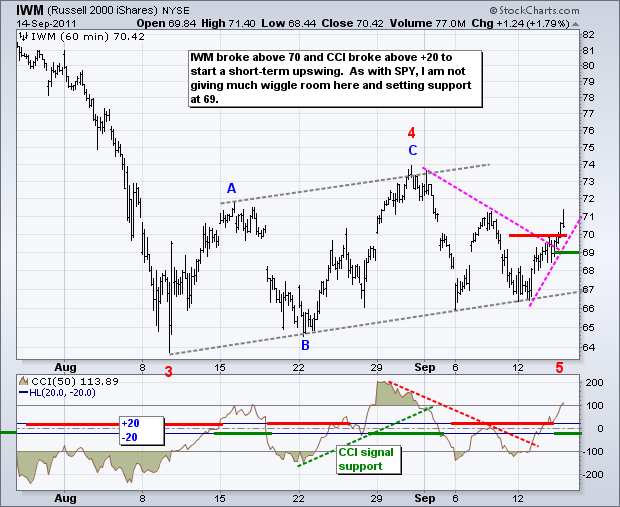
On the price charts, the S&P 500 ETF (SPY) has gone nowhere since August 9th. The bulls are trying their best as the ETF opened below 116 twice and recovered twice. This level marks a medium-term support level. A close below 116 on the daily chart would break the lower trendline of the rising flag and signal the start of a continuation lower. The gray trendlines mark this rising flag. Short-term, the swings within the flag are dictating policy. With a break above 118.50 on Wednesday, the short-term swing is up and I am marking support at 117.90. Yes, I am not giving this upswing too much wiggle room. A move below this level would signal the start of a downswing. Instead of the Percent Price Oscillator (PPO), I am showing the TRIX, which is a bit smoother. The signal line crossovers produce the signals. TRIX is currently moving higher to confirm the current upswing. A move below the signal line would signal a short-term reversal. Trading remains whippy, but, as Ed Seykota of the TradingTribe sings, one good trend pays for all those losses (click here for the Whipsaw Song on youtube). This song has all the trading rules you need. And the music is great too!
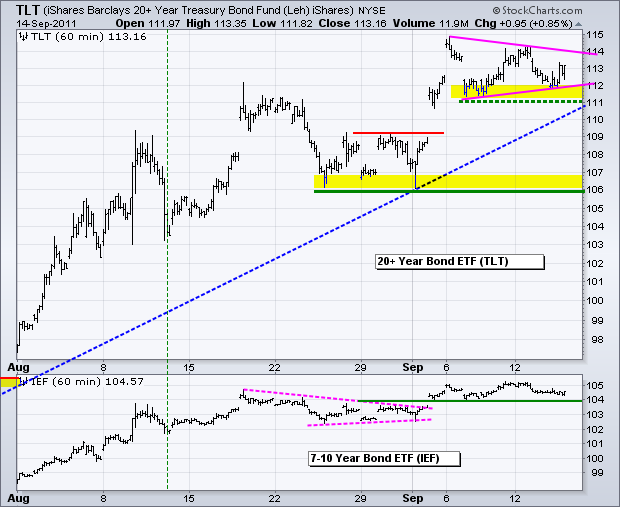
The 20+ year Bond ETF (TLT) broke to new highs in early September and then consolidated the last week or so. The breakout is holding and this is a triangle consolidation in an uptrend. A break above 114 signals another continuation higher. First support is at 111. A break below this level would argue for a deeper pullback and this would be bullish for stocks. Bonds are looking forward to the FOMC meeting next week.
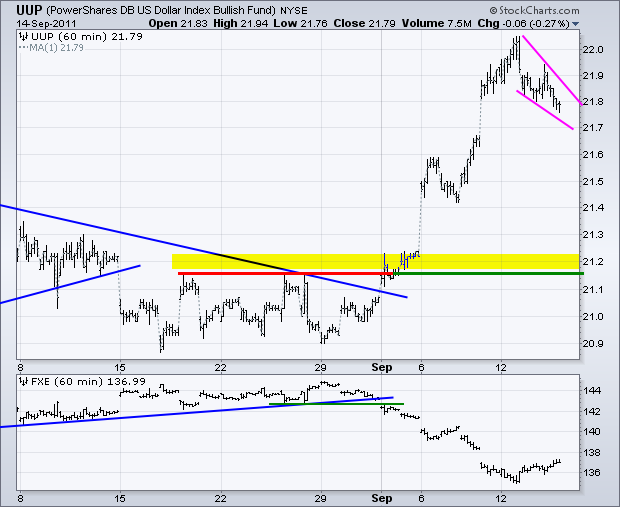
The US Dollar Fund (UUP) pulled back over the last two days to firm a falling wedge. This looks like a correction within a bigger uptrend. A move above 21.90 would signal a continuation higher. Careful with this one because current rhetoric is aimed at shoring up confidence in the Eurozone. It may be hollow and ineffective long-term, but it can move the market short-term.
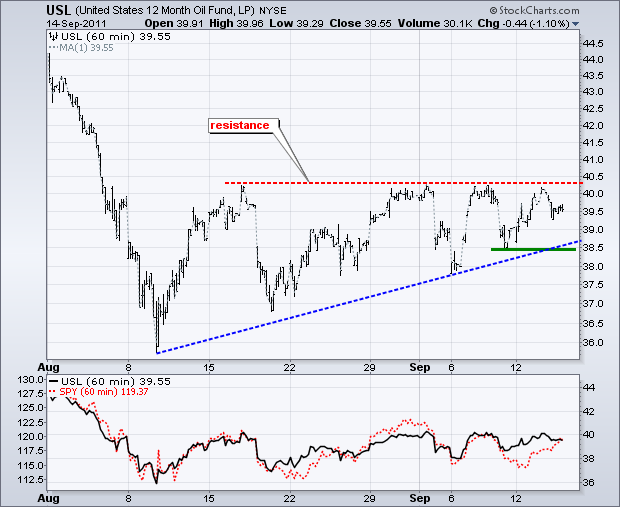
No change in USL. Oil remains surprisingly strong as the 12-Month US Oil Fund (USL) challenges resistance from the Ascending Triangle pattern. Oil is rising despite weakness in European stocks and a surge in the Dollar the last two weeks. A breakout would target further strength to the 43-44 area. Key support is at 38.50.
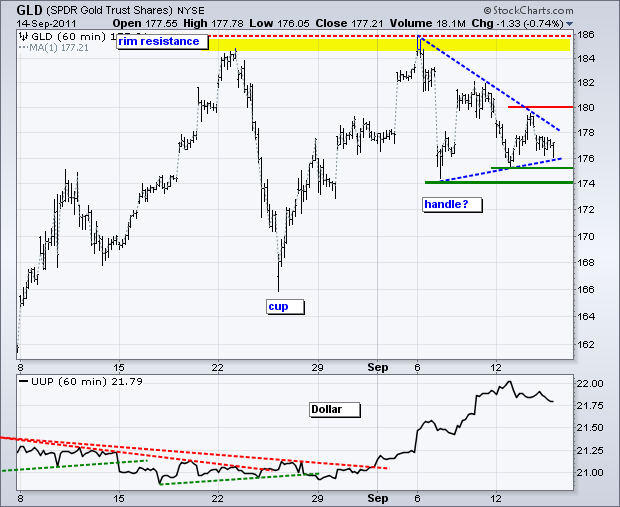
The noose is tightening for gold as the consolidation narrows. The Gold SPDR (GLD) shows lots of support in the 174-176 area and resistance at 180. Look for a break of these levels to trigger the next signal.
Key Economic Reports:
Thu - Sep 15 - 08:30 - Jobless Claims
Thu - Sep 15 - 08:30 - CPI
Thu - Sep 15 - 08:30 - Empire State Manufacturing
Thu - Sep 15 - 09:15 - Industrial Production
Thu - Sep 15 - 09:15 - Capacity Utilization
Thu - Sep 15 - 10:00 - Philadelphia Fed
Thu - Sep 15 - 16:00 - Fed Balance Sheet/Money Supply
Fri - Sep 16 - 09:00 - Net Long-Term TIC Flows
Fri - Sep 16 - 09:55 - Michigan Sentiment
Charts of Interest: Tuesday and Thursday in separate post.
This commentary and charts-of-interest are designed to stimulate thinking. This analysis is not a recommendation to buy, sell, hold or sell short any security (stock ETF or otherwise). We all need to think for ourselves when it comes to trading our own accounts. First, it is the only way to really learn. Second, we are the only ones responsible for our decisions. Think of these charts as food for further analysis. Before making a trade, it is important to have a plan. Plan the trade and trade the plan. Among other things, this includes setting a trigger level, a target area and a stop-loss level. It is also important to plan for three possible price movements: advance, decline or sideways. Have a plan for all three scenarios BEFORE making the trade. Consider possible holding times. And finally, look at overall market conditions and sector/industry performance.

