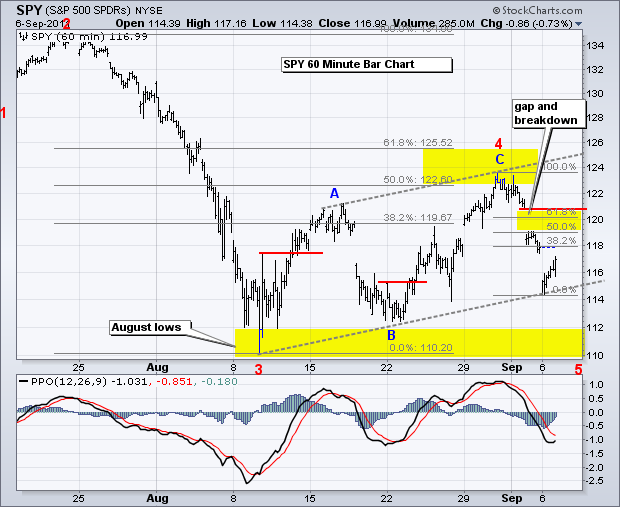
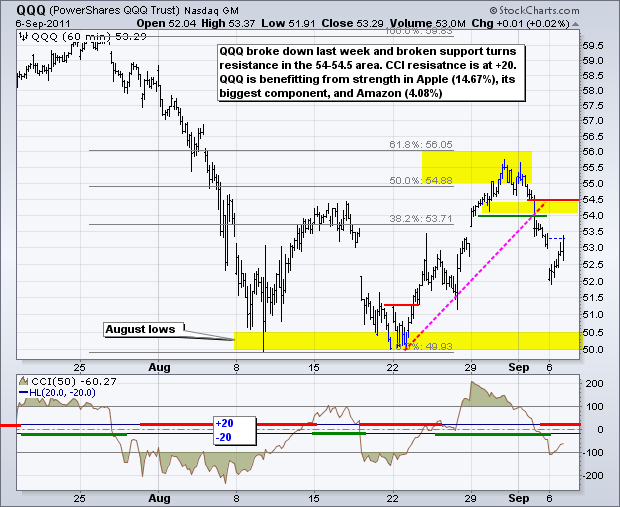
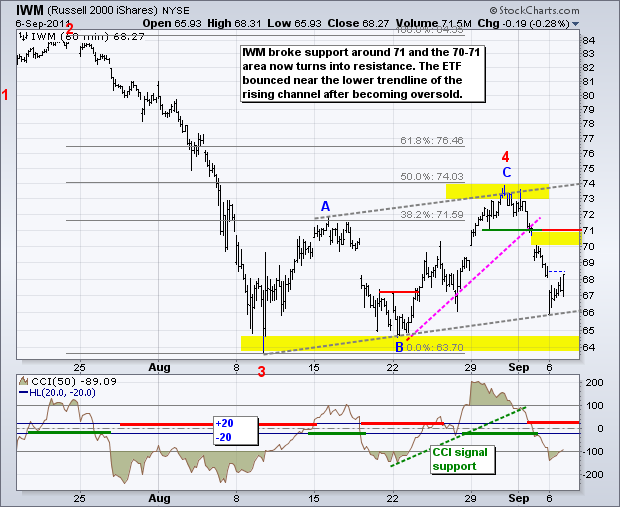
A better-than-expected ISM Services report and oversold conditions gave way to a post-open bounce on Monday. The Nasdaq 100 ETF (QQQ) closed a penny higher, but the rest of the major index ETFs closed with small losses. Eight of the nine sectors were down. Only the Healthcare SPDR (XLV) managed a gain to show some relative strength on the day. It is also worth noting that the Retail SPDR (XRT) ended the day with a gain. Even though the short-term and medium-term trends are clearly down, SPY got an oversold bounce off the trendline extending up from the August lows. This trendline forms the lower boundary of a rising flag on the daily chart. I would not expect this bounce to exceed the 119-120 area. Resistance here stems from the gap zone and 50-61.80% retracements. I would also expect the Percent Price Oscillator (PPO) to meet resistance near the zero line. On the downside, the August lows around 110-112 mark the next target zone. Keep in mind that the Fed will do everything it can to prevent a US recession and the next FOMC meeting is 20-21 September. I am not suggesting that they will be successful, but jawboning and easy money could make for some extremely choppy trading.
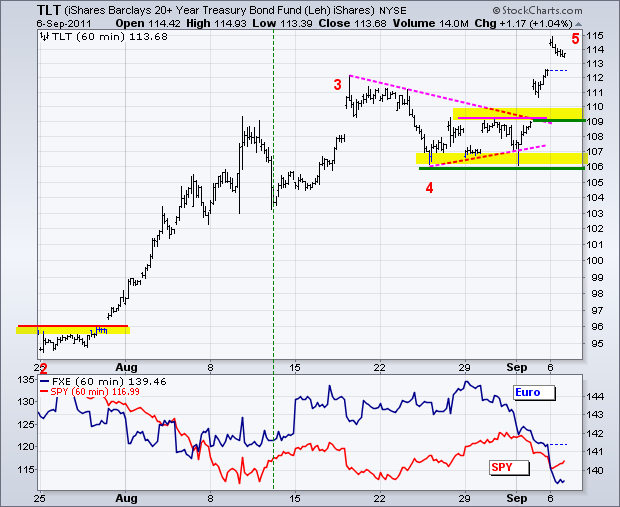
The 20+ year Bond ETF (TLT) is now up around 6.5% this month and trading above the 2008 highs. Keep in mind that StockCharts.com data is adjusted for dividends and payouts. TLT has not exceeded its 2008 high with non-adjusted data. Regardless, TLT is trading at its highest levels since late 2008 and early 2009. This shows an extremely high level of fear (recession, Euro debt, jobs, etc...). TLT peaked at the end of 2008, but stocks did not bottom until early March 2009, which was 2-3 months after the TLT peak. On the 60-minute chart, broken resistance turns into the first support zone around 109-110 and major support remains in the 106 area.
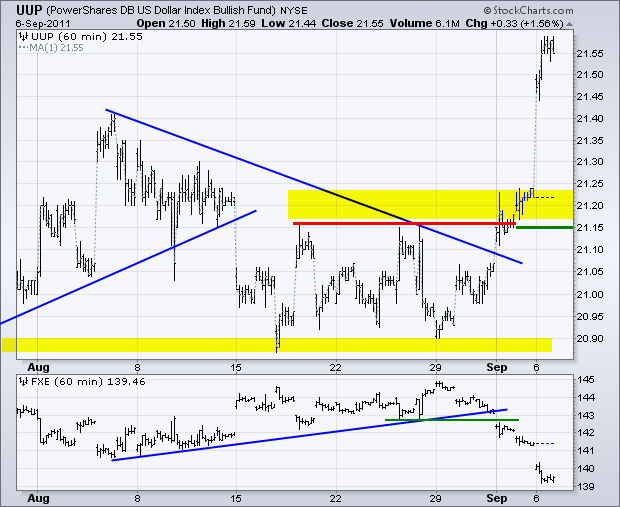
Despite the best efforts by the Swiss to prop up the Euro, the US Dollar Fund (UUP) surged on Tuesday morning and held its gains. The move above the August high is medium-term bullish for the greenback. A move above the May high is needed to reverse the long-term downtrend. Short-term, the breakout at 21.15 is bullish until proven otherwise with a move back below this level. Keep in mind that EU leaders will do everything they can to prop up the Eurozone and prevent a confidence crisis in the Euro. Again, they might not be successful, but they will fight it all the way down.
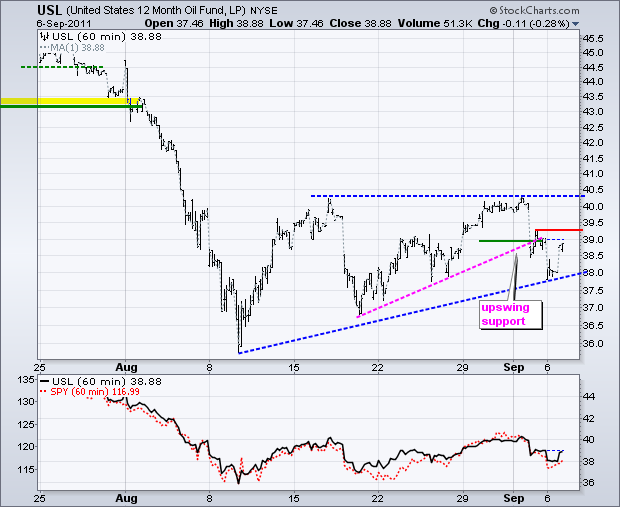
The 12-Month US Oil Fund (USL) opened weak along with the stock market and recovered with a move back towards 39. Broken support in this area turns into the first resistance level to watch. Overall, it is certainly possible that a bullish Ascending Triangle is taking shape since early August (blue lines). A break above the August-September highs would confirm this pattern.
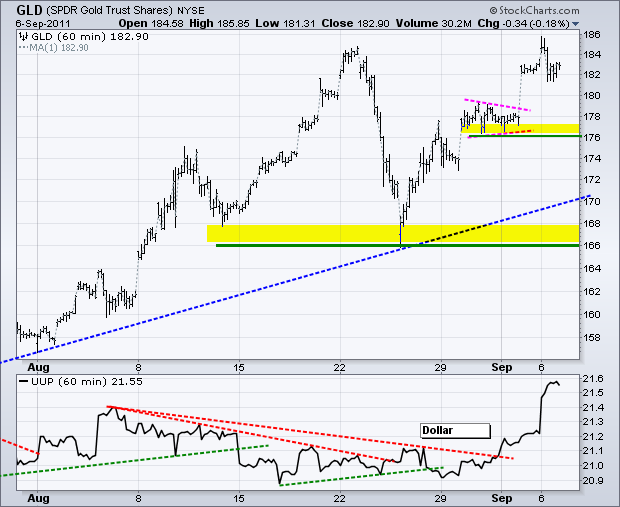
The Gold SPDR (GLD) surged to its August high and stalled as the stock market firmed. Gold was not even concerned with the breakout in the Dollar. As noted many times before, gold thrives on any crisis, be it Dollar, debt or Euro. GLD could get some resistance in the 185 area. First support is set at 176 and major support remains at 166.
Key Economic Reports:
Wed - Sep 07 - 07:00 - MBA Mortgage Index
Wed - Sep 07 - 14:00 - Fed's Beige Book
Thu - Sep 08 - 08:30 - Initial Claims
Thu - Sep 08 - 11:00 - Crude Inventories
Thu - Sep 08 - 15:00 - Consumer Credit
Fri - Sep 09 - 10:00 - Wholesale Inventories
Charts of Interest: Tuesday and Thursday in separate post.
This commentary and charts-of-interest are designed to stimulate thinking. This analysis is not a recommendation to buy, sell, hold or sell short any security (stock ETF or otherwise). We all need to think for ourselves when it comes to trading our own accounts. First, it is the only way to really learn. Second, we are the only ones responsible for our decisions. Think of these charts as food for further analysis. Before making a trade, it is important to have a plan. Plan the trade and trade the plan. Among other things, this includes setting a trigger level, a target area and a stop-loss level. It is also important to plan for three possible price movements: advance, decline or sideways. Have a plan for all three scenarios BEFORE making the trade. Consider possible holding times. And finally, look at overall market conditions and sector/industry performance.

