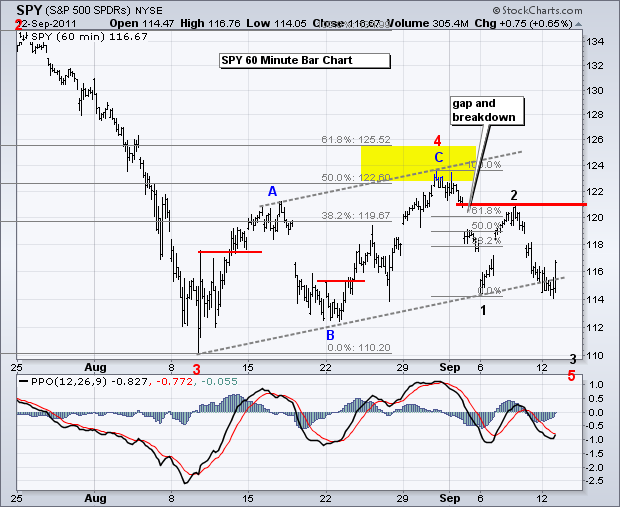
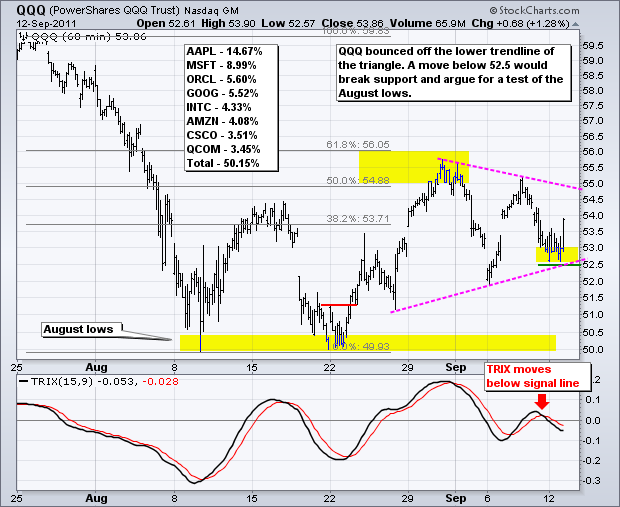
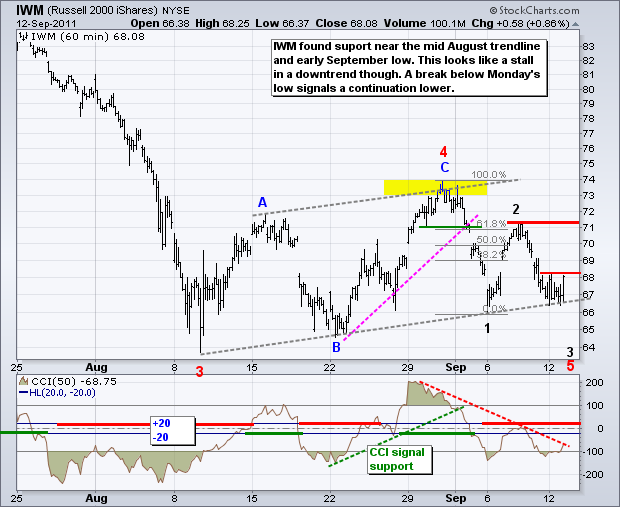
After meandering in negative territory most of the day, stocks surged in the final hour to close with small gains. Rumors were swirling that China was going to buy Greece. That's a joke. Expect more market moving rumors as this crisis unfolds. The Russell 2000 ETF (IWM) and S&P 500 ETF (SPY) held support from last week's low and the Nasdaq 100 ETF (QQQ) formed a higher low with a 1+ percent gain on the day. Despite this late surge, the short-term picture is unchanged. SPY failed at the 61.80% retracement mark and broken support around 121 last week. This bounce marked Wave-2 of a 5-Wave decline. The Thursday-Friday decline signals the start of Wave-3 down and the target is below the August low. Last week's peak now marks key short-term resistance.
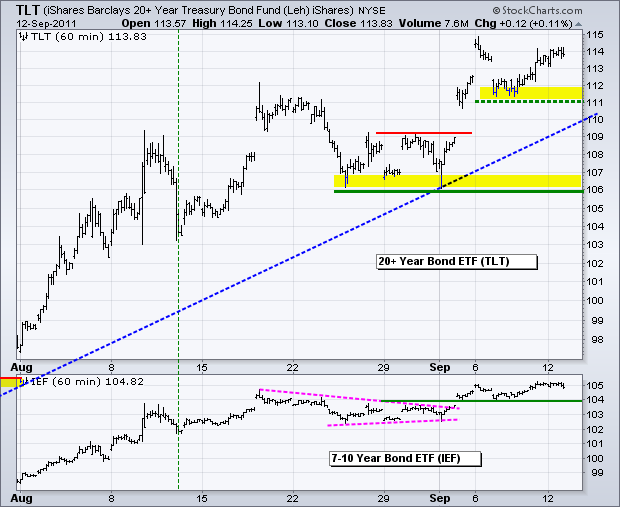
The 20+ year Bond ETF (TLT) edged higher on Monday, but gains were muted considering the declines in Europe. Nevertheless, the overall trend remains up as TLT held support at 111 and moved back towards its early September high. European stocks are down sharply again on Tuesday, as are the Euro and US stock futures. This could keep the bid in bonds.
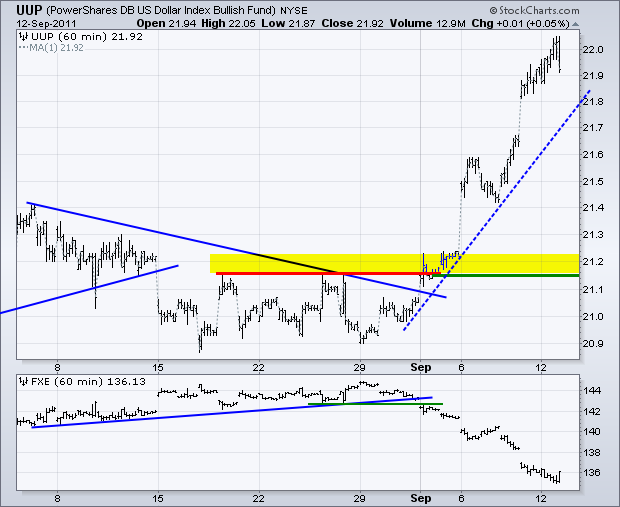
The US Dollar Fund (UUP) declined in the final hour as stocks surged. The Dollar is trading higher this morning and the bigger trends are unaffected by the late decline. At this point, I am not sure where the next support level will be found. The short-term trend is up and sharp. There is a trendline extending up from late August that marks support in the 21.75 area. A move below this level could give way to a correction.
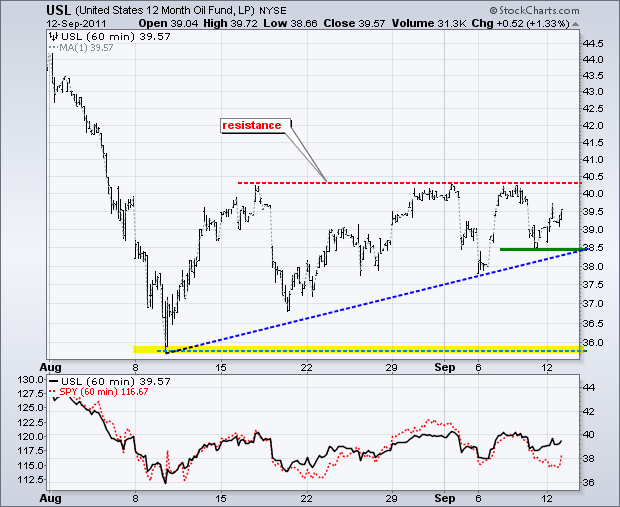
Despite weakness in European stocks and early weakness in US stocks, oil started the day strong and finished with a modest gain. The 12-Month US Oil Fund (USL) ultimately held above last week's low and the Ascending Triangle may still be alive. A break above the August-September highs would confirm this pattern. On the downside, a move below 38.50 would break short-term support. It is hard to imagine oil moving higher with stocks under pressure.
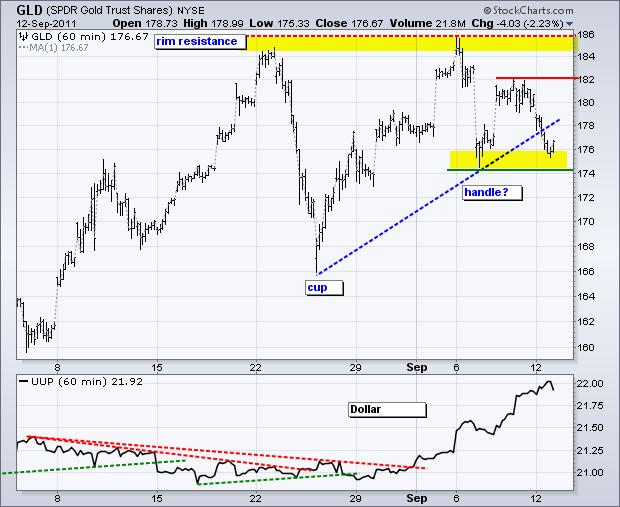
I was quite surprised to see gold and silver down on Monday. Even though US stocks held their own and oil was up, European stocks were down sharply and there was a clear crisis climate throughout the day. This should have benefited gold. Failing to rise in the face of bullish news is a bearish sign. The Gold SPDR (GLD) has support at 174. A break below this level would reverse the short-term uptrend and argue for a deeper pullback. On the bullish side, it is possible that a cup-with-handle pattern is forming. A move above 182 would break first resistance and a move above 186 would break rim resistance.
Key Economic Reports:
Wed - Sep 14 - 07:00 - MBA Mortgage Index
Wed - Sep 14 - 08:30 - PPI
Wed - Sep 14 - 08:30 - Retail Sales
Wed - Sep 14 - 10:00 - Business Inventories
Wed - Sep 14 - 10:30 - Oil Inventories
Thu - Sep 15 - 08:30 - Jobless Claims
Thu - Sep 15 - 08:30 - CPI
Thu - Sep 15 - 08:30 - Empire State Manufacturing
Thu - Sep 15 - 09:15 - Industrial Production
Thu - Sep 15 - 09:15 - Capacity Utilization
Thu - Sep 15 - 16:00 - Fed Balance Sheet/Money Supply
Thu - Sep 15 - 10:00 - Philadelphia Fed
Fri - Sep 16 - 09:00 - Net Long-Term TIC Flows
Fri - Sep 16 - 09:55 - Michigan Sentiment
Charts of Interest: Tuesday and Thursday in separate post.
This commentary and charts-of-interest are designed to stimulate thinking. This analysis is not a recommendation to buy, sell, hold or sell short any security (stock ETF or otherwise). We all need to think for ourselves when it comes to trading our own accounts. First, it is the only way to really learn. Second, we are the only ones responsible for our decisions. Think of these charts as food for further analysis. Before making a trade, it is important to have a plan. Plan the trade and trade the plan. Among other things, this includes setting a trigger level, a target area and a stop-loss level. It is also important to plan for three possible price movements: advance, decline or sideways. Have a plan for all three scenarios BEFORE making the trade. Consider possible holding times. And finally, look at overall market conditions and sector/industry performance.

