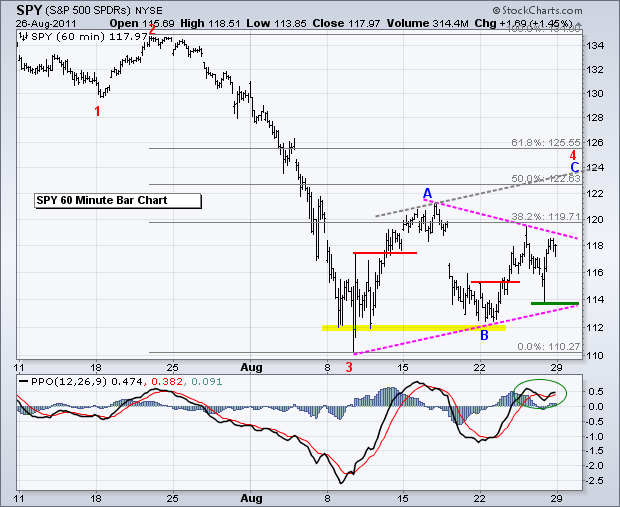
Stocks started weak ahead of Bernanke's speech, but rallied afterwards and closed relatively strong. Bernanke did not offer a QE3 and the speech produced little drama, which is just what the bulls needed. In fact, the reversal from 10AM to 12PM was quite strong. Breadth was decidedly negative at 10AM and moved strongly positive by 12PM. Such a strong reversal may see some follow through this week. On the price chart, SPY dipped below broken resistance and first support on the open, but quickly reversed and rallied above 118. A triangle is still taking shape with resistance close at hand. A breakout here would argue for further strength towards the 122-124 area. With this bounce, I am redoing my Elliott Wave count to show a rising ABC zigzag. Wave C and Wave A are often equal. Moreover, Waves A and C produce 5-wave impulse moves. The current move from Friday's low looks like the start of wave 3 (of C). Momentum-wise, the Percent Price Oscillator (PPO) remains in positive territory to keep short-term momentum bullish. A price break below 113.9 and PPO break into negative territory would be bearish.
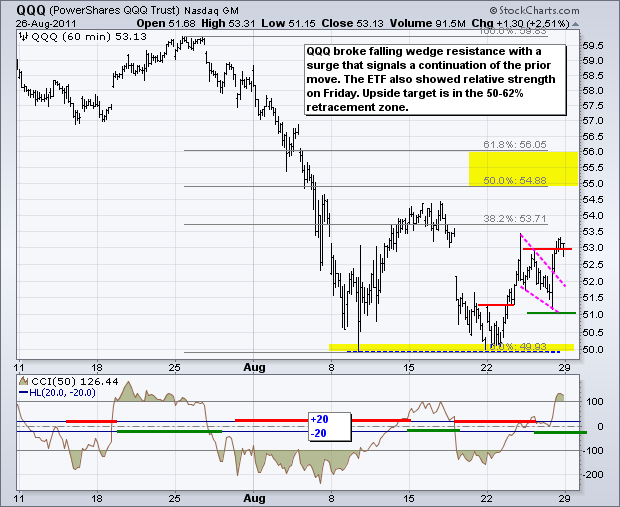
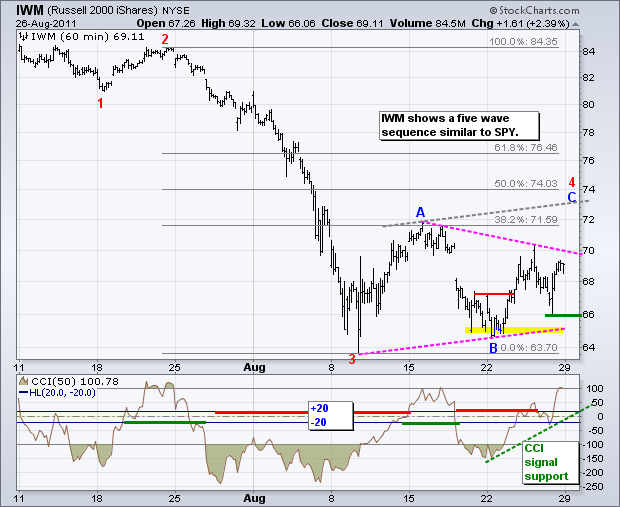
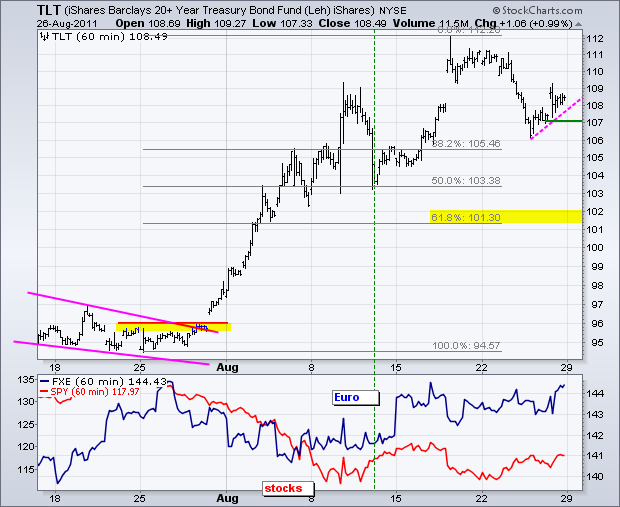
Even though stocks rallied after the Bernanke speech, the 20+ year Bond ETF (TLT) held its gains and finished with a 1% advance on the day. Perhaps the bond market is looking ahead to the September Fed meeting. The two day bounce looks like a rising consolidation with support at 107. A break below 107 would signal a continuation of last week's decline and target further weakness into the 50-61.80% retracement zone.
The Dollar cannot make up its mind. Thursday's breakout was met with selling pressure on Friday as the US Dollar Fund (UUP) plunged below 21. Bonds and the Dollar reacted as if Bernanke proposed QE3 that would be bond bullish and Dollar bearish. Friday's decline was small move in percentage terms, but enough to invalidate the breakout. A rising wedge of sorts has taken shape the last two weeks. A break below last week's low would signal a continuation lower.

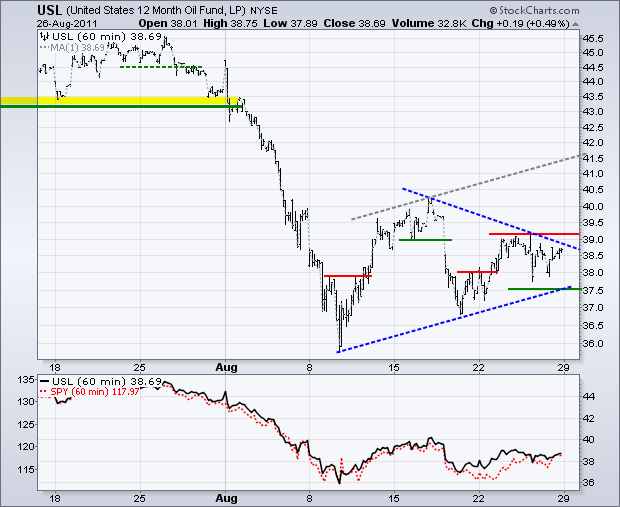
The 12-Month US Oil Fund (USL) remains in a rather tight consolidation. As with SPY, a triangle is taking shape the last few weeks. The trendlines are drawing closer and this means a breakout is imminent. A break above resistance would argue for further strength towards the 41-42 area. Notice that the gray trendline runs parallel to the lower trendline of the triangle and extends from the triangle high. This marks the upside projection. Support is set at 37.50.
The Gold SPDR (GLD) hit its support zone in the 166-168 area and bounced sharply the last two days. The plunge from 184 to 166 shook out the weak hands and the bulls are back in control of the short-term trend. With this bounce, the lows from early to mid August mark an important support zone.

It is a HUGE week for economic reports. Traders will get a real feel for the economy with the Chicago PMI, Factory Orders and the ISM Index. Weak reports in early July and August weighed on the market. September is the chance for redemption or confirmation. The week ends with the Employment Report on Friday.
Key Economic Reports:
Mon - Aug 29 - 08:30 - Personal Income & Spending
Mon - Aug 29 - 10:00 - Pending Home Sales
Tue - Aug 30 - 09:00 - Case-Shiller Housing Index
Tue - Aug 30 - 10:00 - Consumer Confidence
Wed - Aug 31 - 07:30 - Challenger Job Cuts
Wed - Aug 31 - 08:15 - ADP Employment
Wed - Aug 31 - 09:45 - Chicago PMI
Wed - Aug 31 - 10:00 - Factory Orders
Wed - Aug 31 - 10:30 - Oil Inventories
Thu - Sep 01 - 08:30 - Jobless Claims
Thu - Sep 01 - 10:00 - ISM Index
Thu - Sep 01 - 10:00 - Construction Spending
Thu - Sep 01 - 15:00 - Auto-Truck Sales
Fri - Sep 02 - 08:30 - Employment Report - Nonfarm Payrolls
Charts of Interest: Tuesday and Thursday in separate post.
This commentary and charts-of-interest are designed to stimulate thinking. This analysis is not a recommendation to buy, sell, hold or sell short any security (stock ETF or otherwise). We all need to think for ourselves when it comes to trading our own accounts. First, it is the only way to really learn. Second, we are the only ones responsible for our decisions. Think of these charts as food for further analysis. Before making a trade, it is important to have a plan. Plan the trade and trade the plan. Among other things, this includes setting a trigger level, a target area and a stop-loss level. It is also important to plan for three possible price movements: advance, decline or sideways. Have a plan for all three scenarios BEFORE making the trade. Consider possible holding times. And finally, look at overall market conditions and sector/industry performance.
