Unsurprisingly, Congress and the White House struck an 11th hour deal on the debt ceiling. Stock futures are trading higher with the Dow poised to open some 100 points up. Oil is also higher, but bonds, gold and the Dollar are lower (±5AM ET). Technically, stocks were oversold after a sharp decline last week. QQQ was down 2.68% last week, while SPY lost 3.9% and IWM was down 5.13%. Big techs held up the best. Small-caps fared the worst. Relative weakness in small-caps remains a big concern for the market right now. An oversold bounce was already in the cards. The debt-ceiling deal simply spurred the bulls. At this point, I would consider this just a relief rally or oversold bounce within a short-term downtrend. A strong open is one thing. A strong open, further gains and a strong close are another. Also note that it is a big week for economic reporting. The ISM Manufacturing Index is due Monday. Factory Orders, ISM Services and the ADP Employment Report are Wednesday. Jobless Claims are Thursday and the week ends with Non-Farm Payrolls.
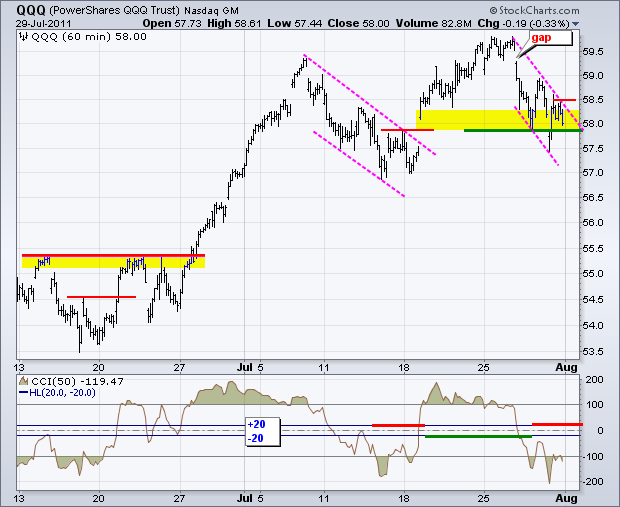
The first chart shows QQQ opening below support on Friday, but quickly recovering and closing above support at 58. With this drop and pop, this zone remains the key support zone. A sharp falling flag formed over the last few days. Technically, a move above 58.5 would break flag resistance and argue for a continuation higher. This would also reinforce the low of the support zone at 57.80. Failure to hold today's opening gap and a move below the support zone would be bearish.
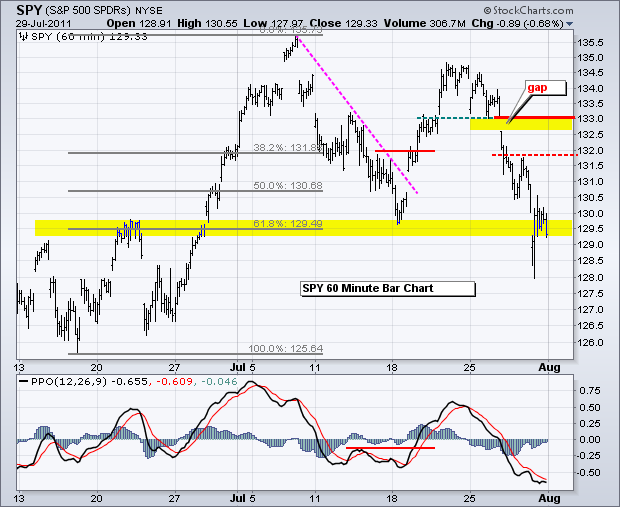
While QQQ held above the mid July low, SPY and IWM broke below this low and showed relative weakness. With the decline back below 130, SPY became short-term oversold and finished the weak near support from broken resistance. I am marking a resistance zone around 132-133. This area stems from Thursday's high, Wednesday's gap and broken support.
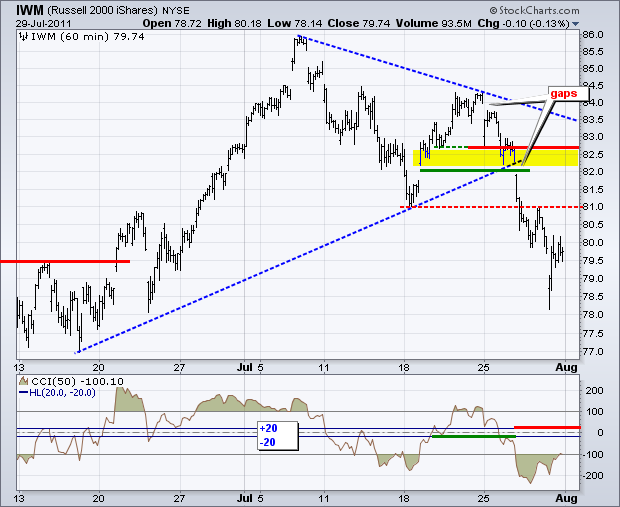
For IWM, broken support turns into first resistance at 81. Wednesday's gap and trendline break mark key resistance in the 82-82.5 area.
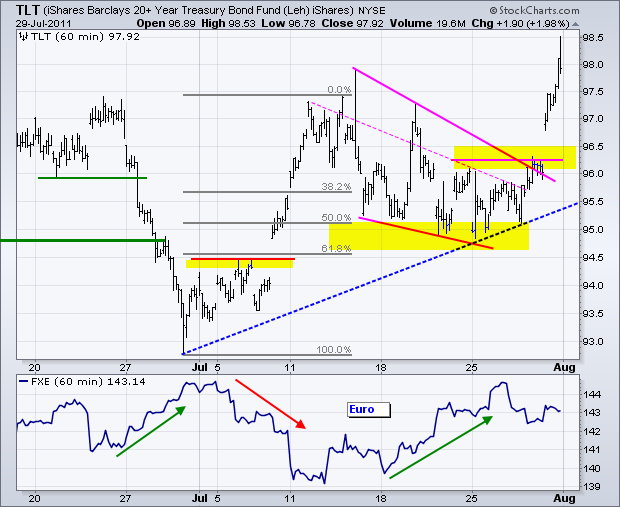
The 20+ year Bond ETF (TLT) broke resistance with a gap and surged above its July highs on Friday. Wow, what a move. Bonds were clearly not concerned with the debt-ceiling debacle. With a deal on the table and stocks rebounding early Monday, bonds are under pressure. Nevertheless, the breakout is there and broken resistance turns into support (96-96.50).
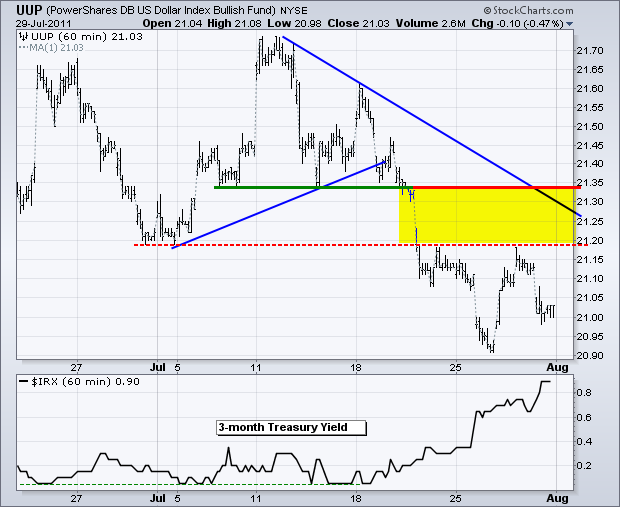
The US Dollar Fund (UUP) remains in bear mode after the support breaks last week. Broken supports at 21.20 and 21.35 turn into a resistance zone. The July trendline confirms resistance here.
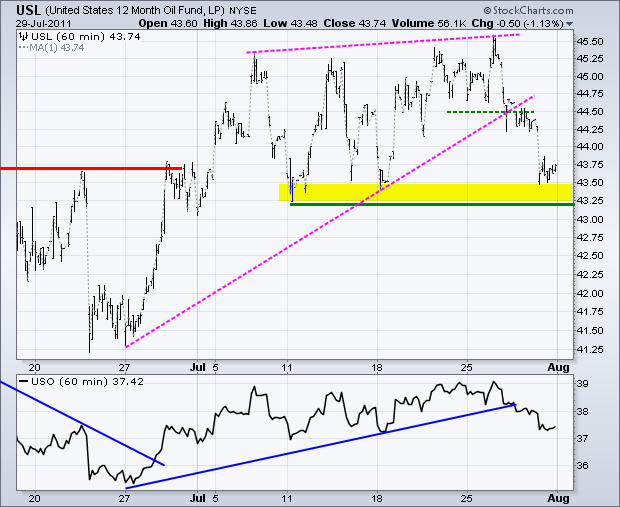
The 12-Month US Oil Fund (USL) broke wedge support and declined to the top of its support zone (43.25-43.50). While the wedge break was the first bearish signal, the bigger support zone loomed as the key level for the bulls. Oil is moving higher in early trading and a bounce today would affirm this support zone. Again, a lot depends on the Dollar and Stocks. Strength in stocks and weakness Dollar would be bullish for crude.
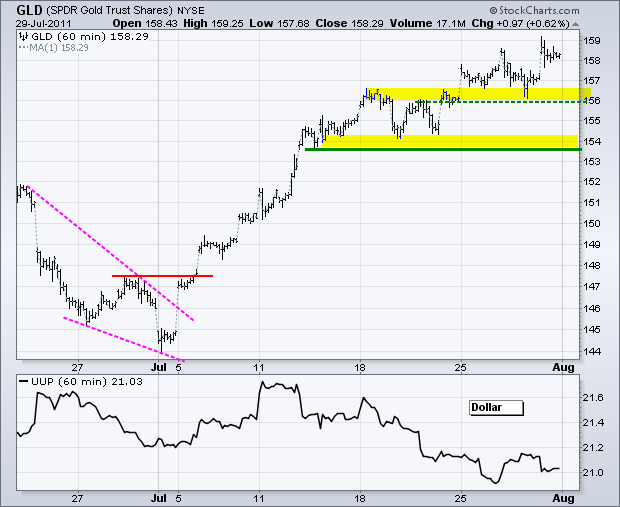
Gold is under pressure this morning as yet another crisis (can) has been kicked down the road. Broken resistance in the 156 area turns into the first support zone. Key support remains in the 154 area.
Key Economic Reports:
Mon - Aug 01 - 10:00 - ISM Index
Mon - Aug 01 - 10:00 - Construction Spending
Tue - Aug 02 - 08:30 - Personal Income
Tue - Aug 02 - 15:00 - Auto/Truck Sales
Wed - Aug 03 - 07:00 - MBA Mortgage Index
Wed - Aug 03 - 08:15 - ADP Employment Report
Wed - Aug 03 - 10:00 - Factory Orders
Wed - Aug 03 - 10:00 - ISM Services
Wed - Aug 03 - 10:30 - Oil Inventories
Thu - Aug 04 - 08:30 - Jobless Claims
Fri - Aug 05 - 08:30 - Employment Report
Charts of Interest: Tuesday and Thursday in separate post.
This commentary and charts-of-interest are designed to stimulate thinking. This analysis is not a recommendation to buy, sell, hold or sell short any security (stock ETF or otherwise). We all need to think for ourselves when it comes to trading our own accounts. First, it is the only way to really learn. Second, we are the only ones responsible for our decisions. Think of these charts as food for further analysis. Before making a trade, it is important to have a plan. Plan the trade and trade the plan. Among other things, this includes setting a trigger level, a target area and a stop-loss level. It is also important to plan for three possible price movements: advance, decline or sideways. Have a plan for all three scenarios BEFORE making the trade. Consider possible holding times. And finally, look at overall market conditions and sector/industry performance.

