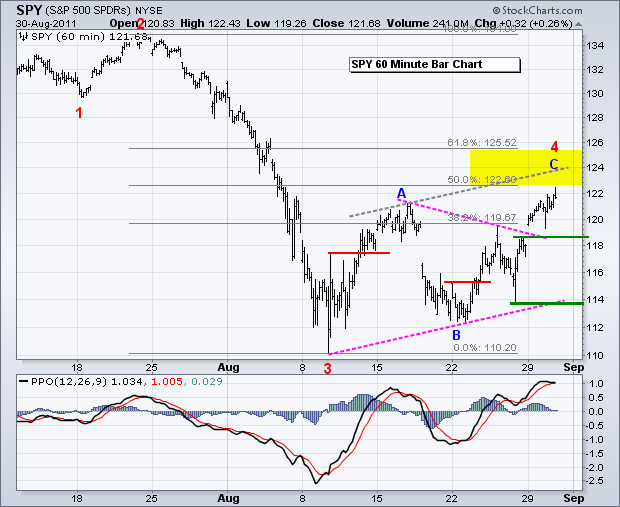
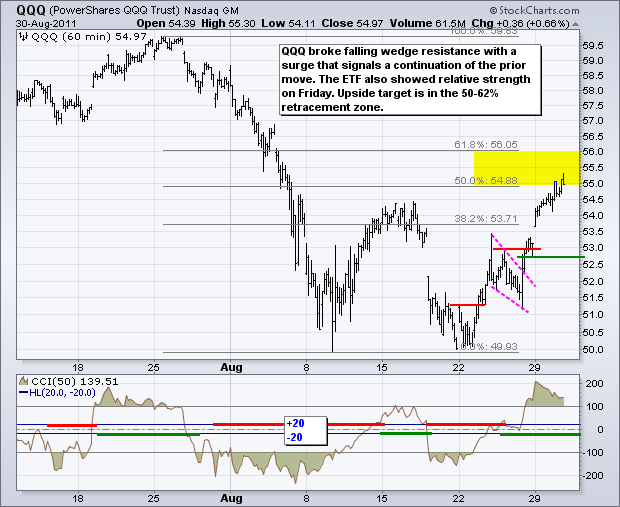
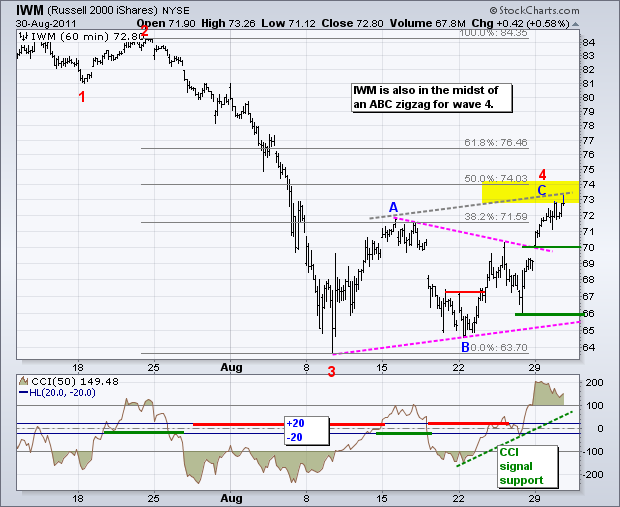
The bulls held up well in the face of a bad consumer confidence report. August consumer confidence hit a two year low. Even though consumer confidence is a lagging indicator, there are fears that this could put pressure on consumer spending. Nevertheless, stocks held on to their gains and the Retail SPDR (XRT) edged higher. Today marks another big test for the bulls. The ADP Employment Report, Chicago PMI and Factory Orders will be reported this morning. There is no change on the price chart for SPY as it edged above its mid August high. SPY is in midst of a fourth wave corrective advance. This pattern looks like an ABC zigzag with a target zone around 123-125. The gray trendline, which is parallel to the lower trendline of the triangle, extends to the 124 area. The 50-61.80% retracement zone also marks resistance here. Monday's gap and triangle break mark the first support zone. A move below 118.50 would negate these signals and suggest that wave 4 has ended. A Percent Price Oscillator (PPO) move into negative territory would confirm.
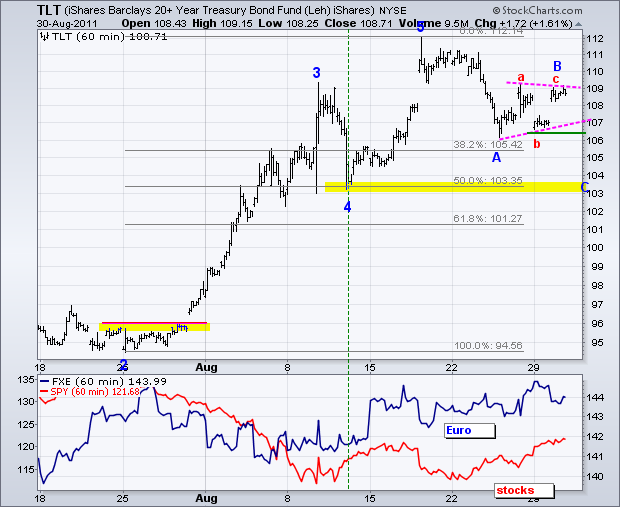
The bond market is just as confused as the US Dollar. First, Bill Gross (PIMCO) coughed up a mea culpa this week with his admission that betting against Treasuries was a bad idea. Second, the Fed minutes show a divided FOMC. Third, the 20+ year Bond ETF (TLT) has gone nowhere since the second week of August, which is when it first reached 109. After dipping below 107 on Monday, TLT surged back above 108 on Tuesday and closed fairly strong. The big trend is up and this resilience favors the bulls. It is still possible that an ABC correction is taking shape, but the bears are going to need some help from the economic reports and stock market in the next two days. Positive economic reports and further gains in stocks would be bearish for bonds. The current pennant looks like a smaller abc corrective wave that forms the bigger wave B. A break below Monday's low would signal a continuation lower for wave C. Negative economic reports and weakness in stocks would be bullish for bonds.
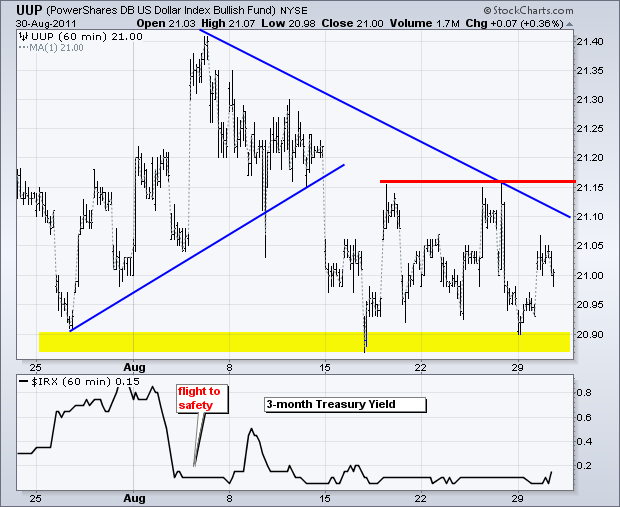
The US Dollar Fund (UUP) declined to support from lows that extend back to late April and consolidated the last two weeks. The Euro Currency Trust (FXE) cannot break resistance and UUP cannot break support. Nobody wants to hold either currency for an extended length of time. There is a pretty clear resistance zone around 21.15 from the highs of the last two weeks. Look for a break above this level to show some confidence in the greenback and doubts on the Euro.
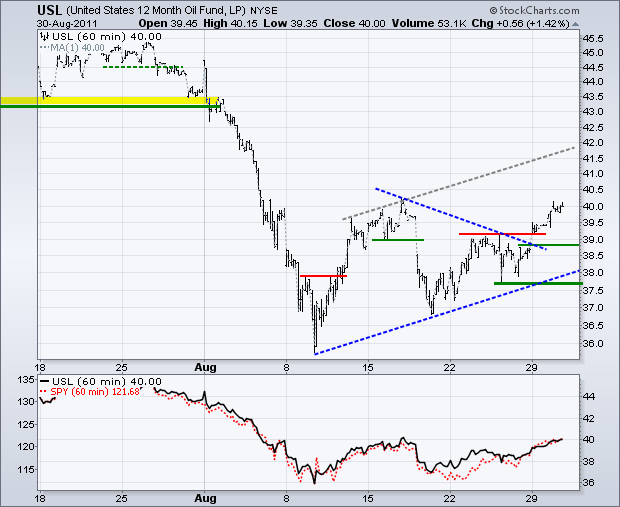
The 12-Month US Oil Fund (USL) continued its advance along side the stock market. The ETF broke triangle resistance and the upside target is in the low 40s. The gray trendline was drawn parallel to the lower trendline of the triangle and extended from the triangle high for a target. I am marking first support at 38.90.
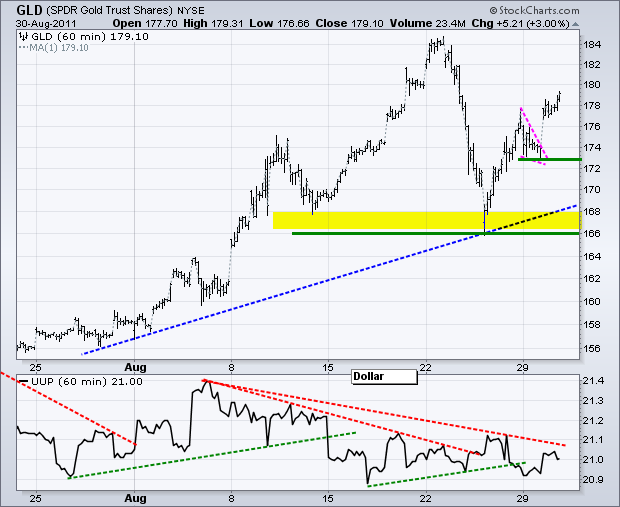
So much for the potential Head-and-Shoulders pattern. The Gold SPDR (GLD) broke above wedge resistance with a surge on Tuesday. This move reinforces support from Monday's low and the bulls are in control as long as bullion holds these lows.
Key Economic Reports:
Wed - Aug 31 - 07:30 - Challenger Job Cuts
Wed - Aug 31 - 08:15 - ADP Employment
Wed - Aug 31 - 09:45 - Chicago PMI
Wed - Aug 31 - 10:00 - Factory Orders
Wed - Aug 31 - 10:30 - Oil Inventories
Thu - Sep 01 - 08:30 - Jobless Claims
Thu - Sep 01 - 10:00 - ISM Index
Thu - Sep 01 - 10:00 - Construction Spending
Thu - Sep 01 - 15:00 - Auto-Truck Sales
Fri - Sep 02 - 08:30 - Employment Report - Nonfarm Payrolls
Charts of Interest: Tuesday and Thursday in separate post.
This commentary and charts-of-interest are designed to stimulate thinking. This analysis is not a recommendation to buy, sell, hold or sell short any security (stock ETF or otherwise). We all need to think for ourselves when it comes to trading our own accounts. First, it is the only way to really learn. Second, we are the only ones responsible for our decisions. Think of these charts as food for further analysis. Before making a trade, it is important to have a plan. Plan the trade and trade the plan. Among other things, this includes setting a trigger level, a target area and a stop-loss level. It is also important to plan for three possible price movements: advance, decline or sideways. Have a plan for all three scenarios BEFORE making the trade. Consider possible holding times. And finally, look at overall market conditions and sector/industry performance.
