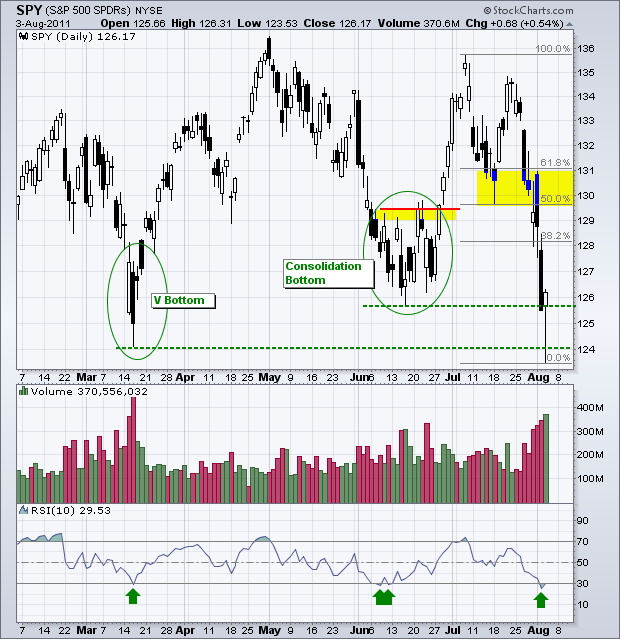
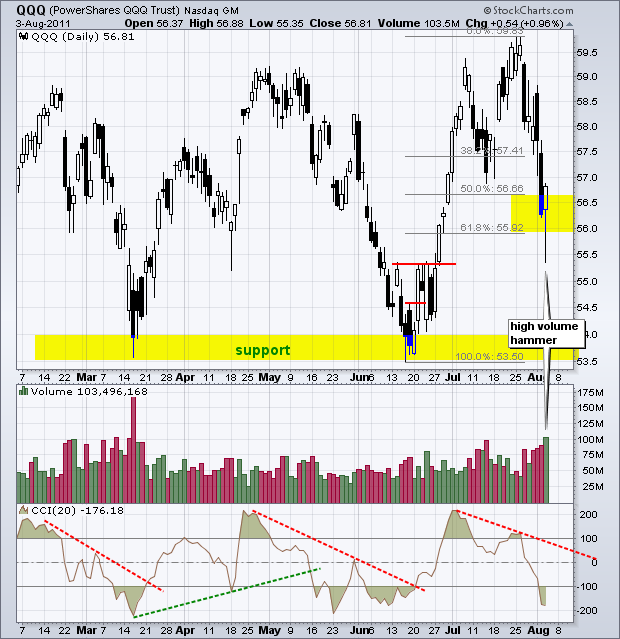
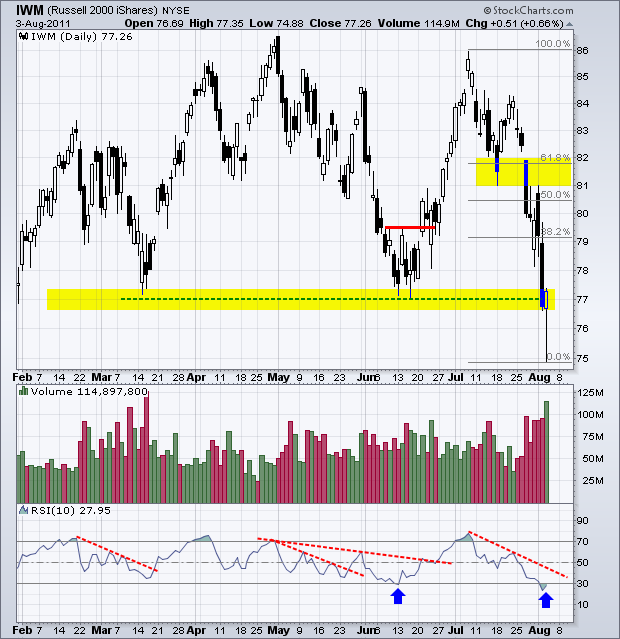
After becoming oversold on Tuesday, the major index ETFs formed high-volume hammers on Wednesday. Today's report will feature daily charts to get some perspective. SPY dipped below 124 and below its March low, but recovered to close above 126. Volume was the highest since the March low. The combination of high-volume hammers and oversold conditions increases the chances of an oversold bounce. Broken support around 130-131 turns into the first resistance level to watch. This area also marks a 50-61.80% retracement of the July-August decline. As far as I am concerned, risk remains high for both bulls and bears. Moreover, I expect some volatility as the bulls and bears slug it out in the next few days, perhaps weeks. The bears look strong after the eight day decline, but the bulls have the high-volume hammer at support on their side. Also keep in mind that the ADP Employment Report is today and the big Employment Report (non-farm payrolls) is tomorrow.
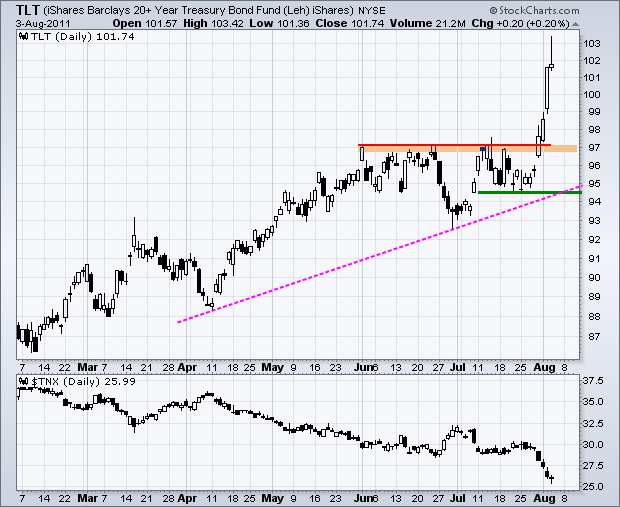
The 20+ year Bond ETF (TLT) formed an inverse Head-and-Shoulders pattern in June-July and broke neckline resistance with last week's surge above 97. In contrast to the hammers above, TLT formed a shooting star. The shooting star is a bearish reversal pattern that could lead to a throwback to broken resistance, which becomes support. Also note that TLT is as overbought as stocks are oversold.
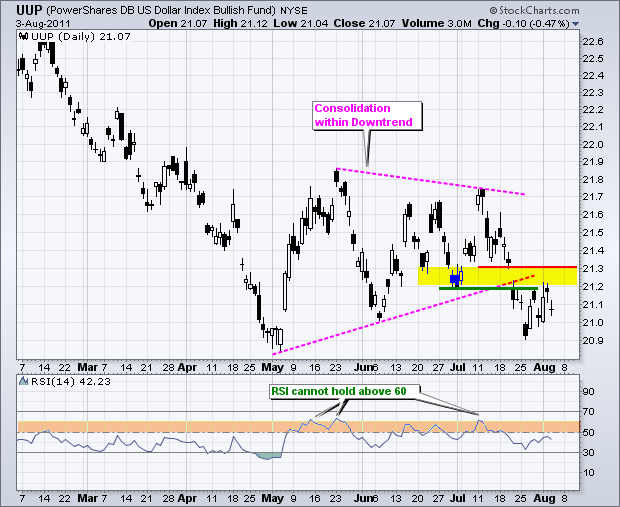
Today could be a big day for the Dollar – via the Euro. The European Central Bank (ECB) meets today with a rate decision expected before the US open. Prior policy statements were hawkish and favored higher interest rates. There is talk now that this hawkish stance could change, which would put pressure on the Euro. A decline in the Euro would be bullish for the Dollar. On the price chart, the US Dollar Fund (UUP) continues to consolidate after a triangle support break. Broken support turns into the first resistance zone (21.2-21.3). A break back above this level would negate the triangle break and raise the prospects of a Double Bottom.
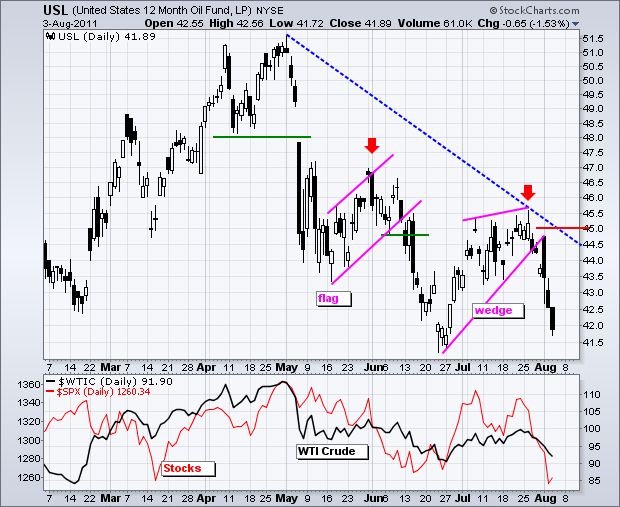
Is it possible that oil was/is leading the stock market? Notice how the 12-Month US Oil Fund (USL) peaked in April and then formed lower highs in May and July. The S&P 500 was headed this way, but the late June surge carried it back to its May highs. Stocks rejoined oil with the sharp decline of the last few weeks. USL broke wedge support and moved sharply lower the last five days. Resistance is marked at 45.
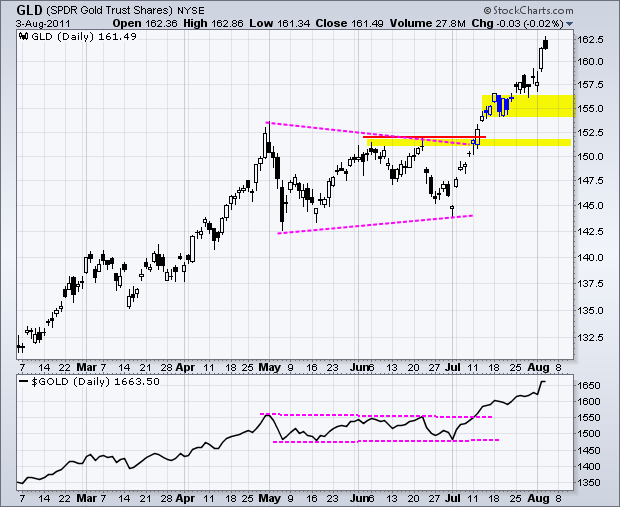
The Gold SPDR (GLD) broke above triangle resistance with a surge in early July and gold moved above 1650. There is nothing but uptrend on these charts. GLD is, however, short-term overbought and ripe for a pullback or consolidation. The first support zone is set around 155 and the second around 151.
Key Economic Reports:
Thu - Aug 04 - 08:30 - Jobless Claims
Fri - Aug 05 - 08:30 - Employment Report
Charts of Interest: Tuesday and Thursday in separate post.
This commentary and charts-of-interest are designed to stimulate thinking. This analysis is not a recommendation to buy, sell, hold or sell short any security (stock ETF or otherwise). We all need to think for ourselves when it comes to trading our own accounts. First, it is the only way to really learn. Second, we are the only ones responsible for our decisions. Think of these charts as food for further analysis. Before making a trade, it is important to have a plan. Plan the trade and trade the plan. Among other things, this includes setting a trigger level, a target area and a stop-loss level. It is also important to plan for three possible price movements: advance, decline or sideways. Have a plan for all three scenarios BEFORE making the trade. Consider possible holding times. And finally, look at overall market conditions and sector/industry performance.

