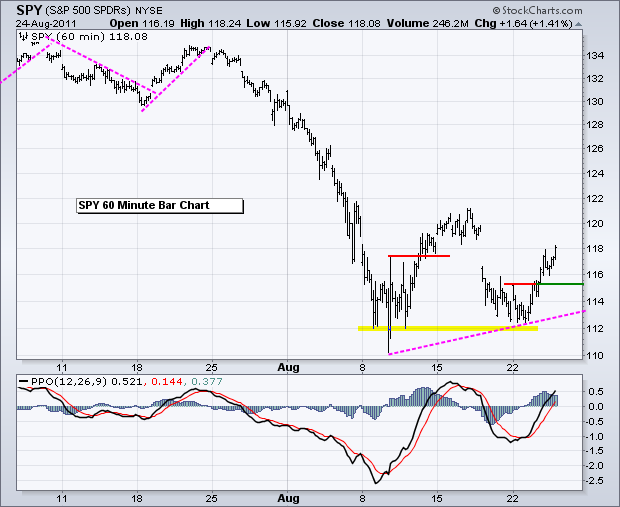
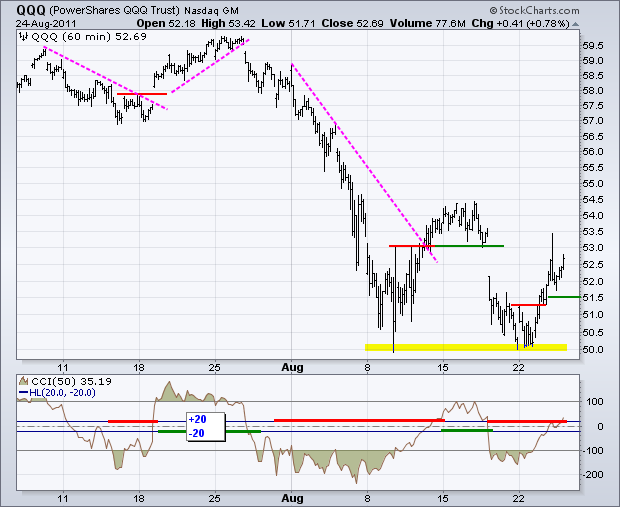
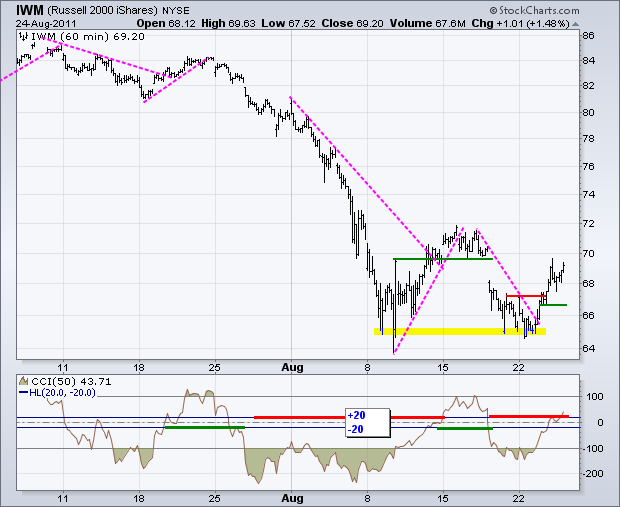
A late rally saved the day for the bulls as the major index ETFs closed strong. The S&P 500 ETF (SPY) and Russell 2000 ETF (IWM) led the way higher with gains around 1.5%. The Nasdaq 100 ETF (QQQ) lagged with a gain that was less than 1%. On the price charts, the oversold bounce continues as the breakouts in IWM, QQQ and SPY hold. At this point, it simply a matter or waiting for the next signal. In the meantime, I am raising support levels to trail the short-term bounce. Yes, I trust this bounce about as far as I can throw it, which ain't far. Perhaps my lack of trust will provide the wall of worry for stocks to climb. SPY broke above short-term resistance and held the breakout. Broken resistance turns into first support. A move below 115.20 would negate this breakout. Chartists can also watch for a signal line cross in the Percent Price Oscillator (PPO) to signal a downturn in prices.
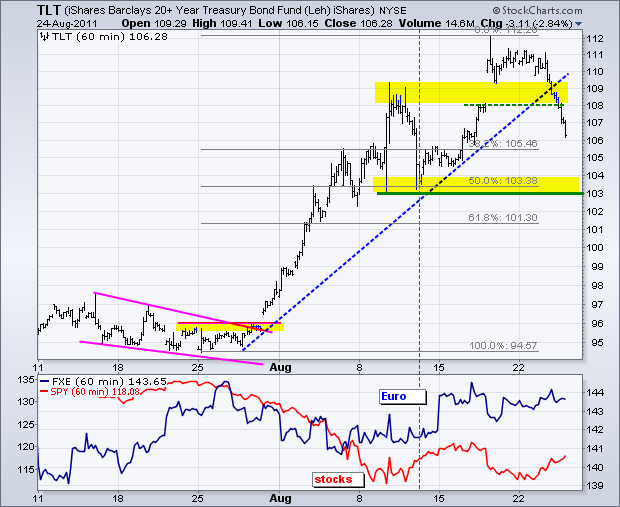
The 20+ year Bond ETF (TLT) took another hit on Wednesday with a break below first support at 108. The next support zone resides in the 103-104 area. The mid August lows and 50% retracement combine to mark potential support here. Keep in mind that predicting support, resistance and reversal-points is an inexact science. The first step is to estimate support or resistance. The second step is to be on alert for a reversal when prices reach this area. The third step is to get a confirming signal. I am currently in step two: estimating support for TLT. We have yet to see any signs of firmness or a reversal signal for validation.
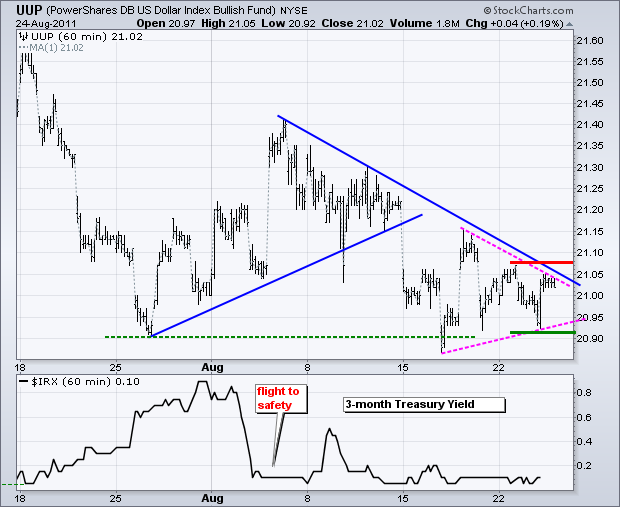
There is no real change in the Dollar analysis as support and resistance tightened. Nobody wants the Dollar or the Euro. It is like an old fashion game of hot potato. The three week trend is clearly down with a triangle forming the last few days. A break below triangle support would signal a continuation lower. A break above triangle resistance reverses the downtrend. We will likely see a break in the next two days because Bernanke speaketh on Friday.
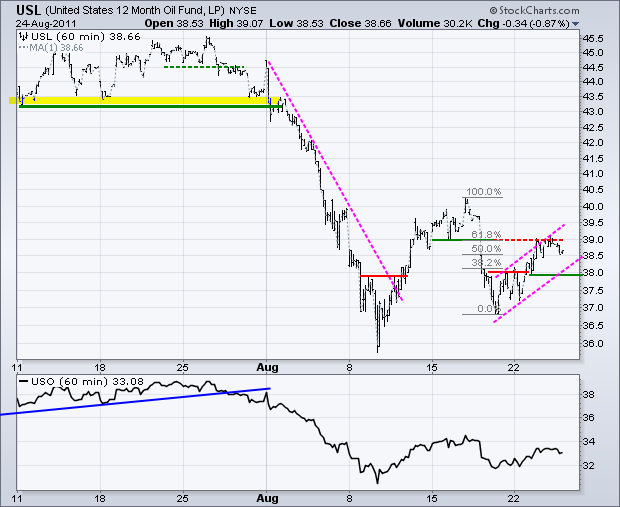
The 12-Month US Oil Fund (USL) advanced to resistance at 39 and stalled over the last two days. Resistance here stems from broken support and some crazy Italian retracement. It's ok, I have a bit of Sicilian blood. The advance over the last few days looks like a rising flag and the bulls have the edge as long as it rises. As with SPY, I am raising support to trail this rise. A move below 37.9 would break flag support.
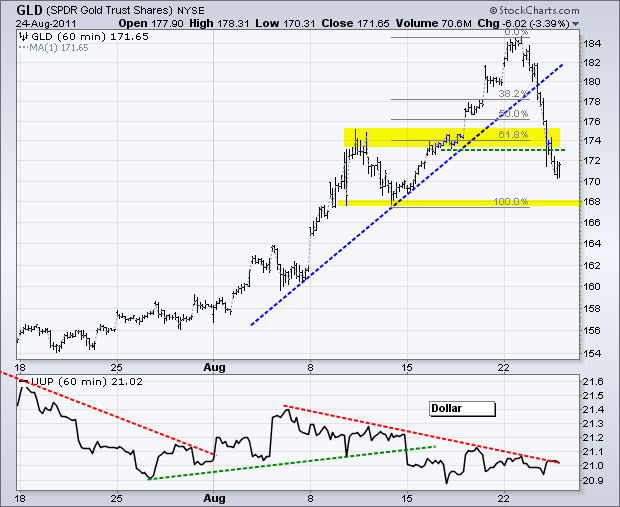
The Gold SPDR (GLD) blew through the first support zone around 174 as selling pressure intensified. The CME announced an increase in margin requirements for gold on Wednesday, which is effective on Thursday. This increase was likely a factor in selling pressure over the last two days as weaker hands were forced out. The next potential support level is around 168 from the mid August low.
Key Economic Reports:
Thu - Aug 25 - 08:30 - Jobless Claims
Thu - Aug 25 - 08:30 – Kansas City Fed Conference in Jackson Hole
Fri - Aug 26 - 08:30 - GDP
Fri - Aug 26 - 09:55 - Michigan Sentiment
Fri - Aug 26 – 10:00 – Bernanke Speaks from Jackson Hole
Charts of Interest: Tuesday and Thursday in separate post.
This commentary and charts-of-interest are designed to stimulate thinking. This analysis is not a recommendation to buy, sell, hold or sell short any security (stock ETF or otherwise). We all need to think for ourselves when it comes to trading our own accounts. First, it is the only way to really learn. Second, we are the only ones responsible for our decisions. Think of these charts as food for further analysis. Before making a trade, it is important to have a plan. Plan the trade and trade the plan. Among other things, this includes setting a trigger level, a target area and a stop-loss level. It is also important to plan for three possible price movements: advance, decline or sideways. Have a plan for all three scenarios BEFORE making the trade. Consider possible holding times. And finally, look at overall market conditions and sector/industry performance.
