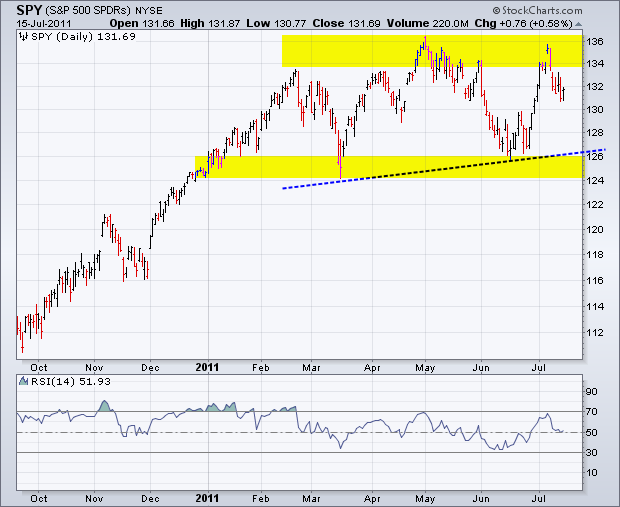
The decline in stocks over the last six days looks like a correction after a sharp advance. The major index ETFs moved sharply higher from mid June to early July. From the June 15th low to the July 7th high, SPY was up over 6%, while QQQ and IWM were up around 9%. Moreover, IWM and QQQ were up eight days in a row after the July 7th close. This strong advance looks impulsive in nature and is certainly entitled to a correction. Before hitting the 60-minute charts, let's review the daily chart for SPY. The overall trend remains up as SPY hit a new high on May 2nd and held above its March low in mid June. There is a lot of support in the 124-126 area as well as some resistance in the 134-136 area.
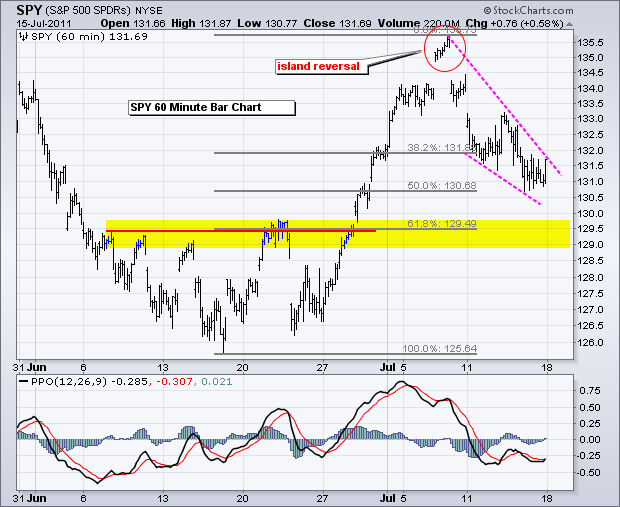
On the 60-minute chart, SPY broke resistance around 129-129.5 and surged above 135 with a gap up on July 7th. This gap was quickly countered with a gap down to form an island reversal. SPY declined below 131 with a falling wedge taking shape last week. Support from the 50-61.80% retracement zone and broken resistance is coming into play in 129.5-130.7 area, but the wedge is still falling and momentum remains bearish. A surge above 132 is needed to break wedge resistance. The Percent Price Oscillator (PPO) needs to break back into positive territory to turn short-term momentum bullish again.
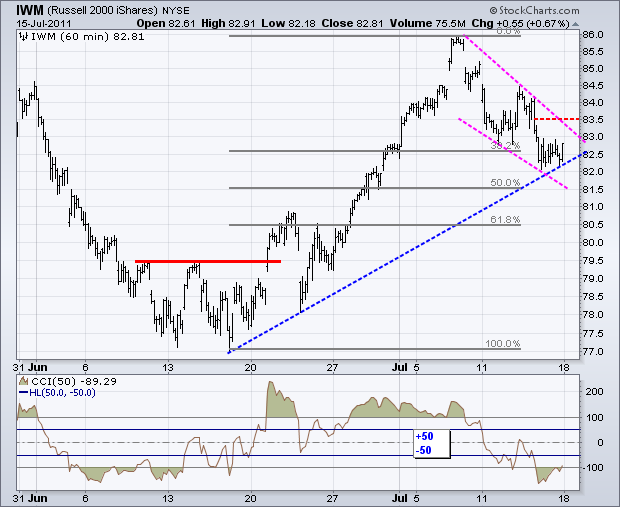
The Russell 2000 ETF (IWM) outperformed SPY on the way up and retraced less on the way down. IWM firmed around 82 late last week, an area that marks a 38.2-50% retracement of the prior advance. There is also potential support here from the mid June trendline. I am marking falling wedge resistance at 83.5 for now. CCI remains in bear mode after breaking below -20 last week. A move above +20 is needed to turn momentum bullish again.
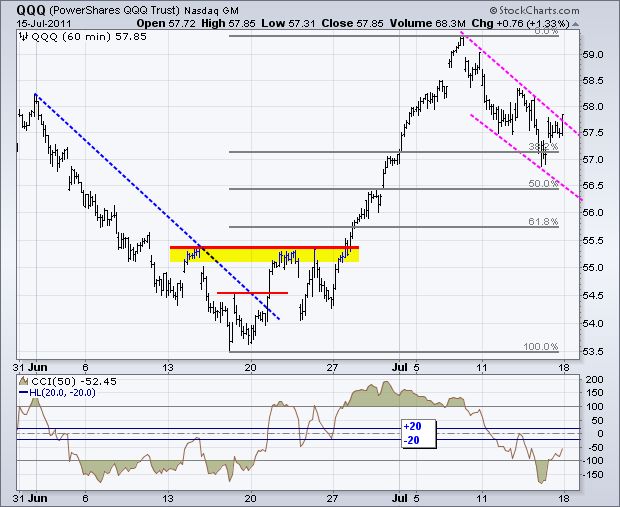
Powered by Apple (AAPL), the Nasdaq 100 ETF (QQQ) surged from 54.27 to 59.36 in just eight days. The ETF was clearly overbought and ripe for a correction of some sort. With a decline to around 57, the ETF retraced 38.2% of the June-July advance. A falling channel took shape and QQQ broke above the upper trendline with a last hour surge on Friday. Let's see if IWM and SPY confirm with breakouts. CCI remains in bear mode after the plunge below -20 last week. A confirming surge above +20 would turn momentum bullish.
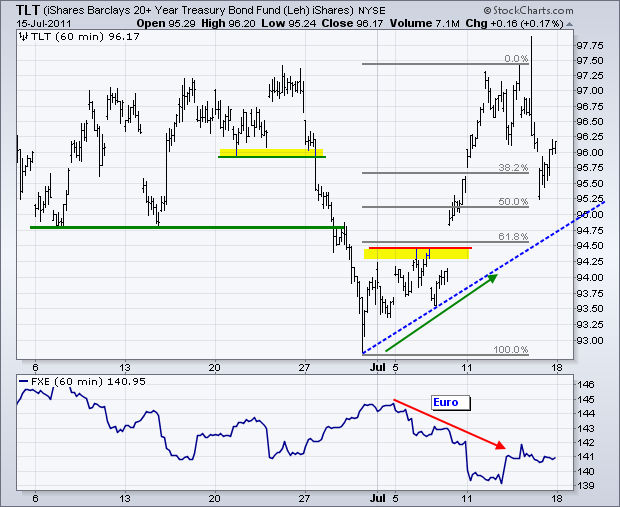
A plunge in the Euro triggered a move into US Treasuries as the 20+ year Bond ETF (TLT) surged the last two weeks. TLT met resistance near the June highs and pulled back late last week. I don't see any meaningful setup on this chart right now. Treasuries should benefit as long as the Euro remains under pressure.
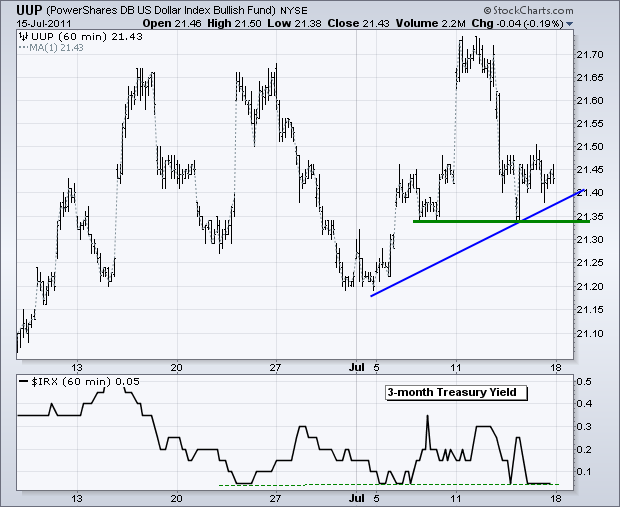
The US Dollar Fund (UUP) remains in an uptrend overall, but very choppy with violent swings over the last few weeks. The ETF established support around 21.35 with lows from early and mid July. A break below these lows would be short-term bearish. The indicator window shows the 3-month T-Bill Yield ($IRX) trading below .05, which is about as close to zero as it can get. This reflects a move away from the Euro and Euro-denominated bonds.
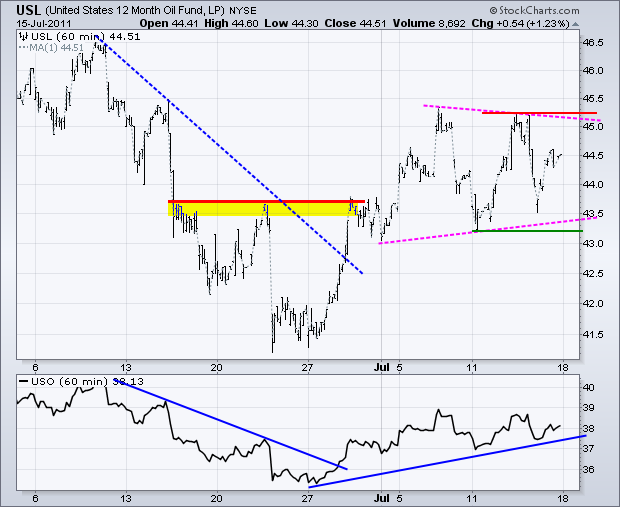
The 12-Month US Oil Fund (USL) broke resistance with a surge in late June and early July. A triangle consolidation then took shape as the ETF consolidated its gains. Broken resistance turned into support and is holding. Last week's range marks support and resistance. Look for a break above last week's high to signal a continuation higher. A break below last week's low would argue for a test of the June lows.
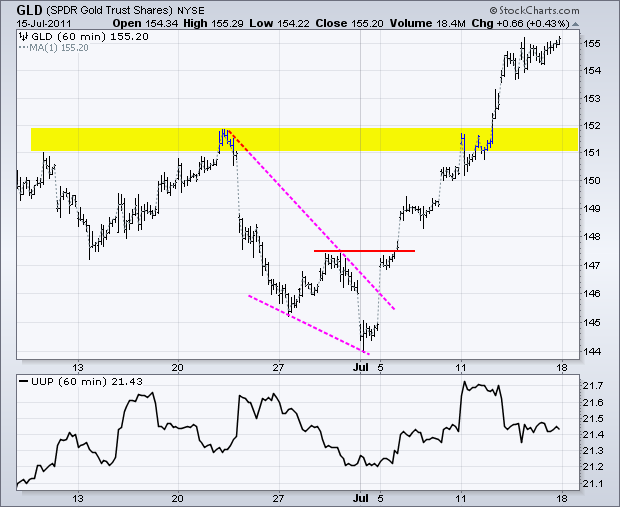
The Gold SPDR (GLD) went ballistic over the last two weeks. GLD broke resistance around 147.5 the first week of July and never looked back. After a 7+ percent move, the ETF is short-term overbought and ripe for a correction or consolidation. Broken resistance around 151-152 turns into the first support zone to watch.
Key Economic Reports:
Mon - Jul 18 - 10:00 - NAHB Housing Market Index
Tue - Jul 19 - 08:30 - Housing Starts/Building Permits
Wed - Jul 20 - 10:00 - Existing Home Sales
Wed - Jul 20 - 10:30 - Oil Inventories
Thu - Jul 21 - 08:30 - Jobless Claims
Thu - Jul 21 - 10:00 - Philadelphia Fed
Thu - Jul 21 - 10:00 - Leading Indicators
Chart of Interest: Tuesday and Thursday in separate post.
This commentary and charts-of-interest are designed to stimulate thinking. This analysis is not a recommendation to buy, sell, hold or sell short any security (stock ETF or otherwise). We all need to think for ourselves when it comes to trading our own accounts. First, it is the only way to really learn. Second, we are the only ones responsible for our decisions. Think of these charts as food for further analysis. Before making a trade, it is important to have a plan. Plan the trade and trade the plan. Among other things, this includes setting a trigger level, a target area and a stop-loss level. It is also important to plan for three possible price movements: advance, decline or sideways. Have a plan for all three scenarios BEFORE making the trade. Consider possible holding times. And finally, look at overall market conditions and sector/industry performance.

