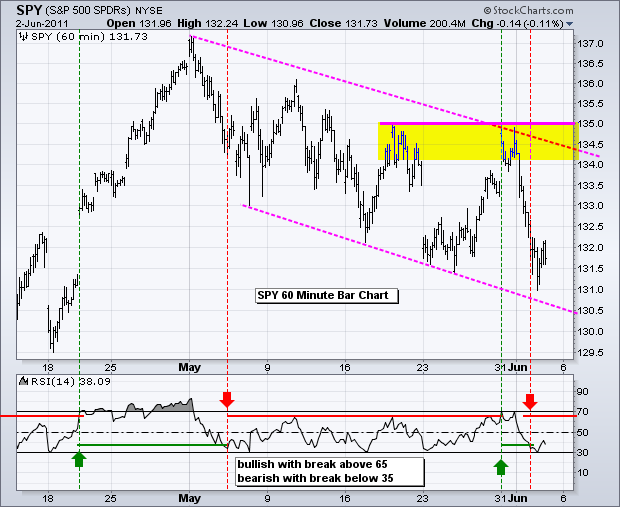
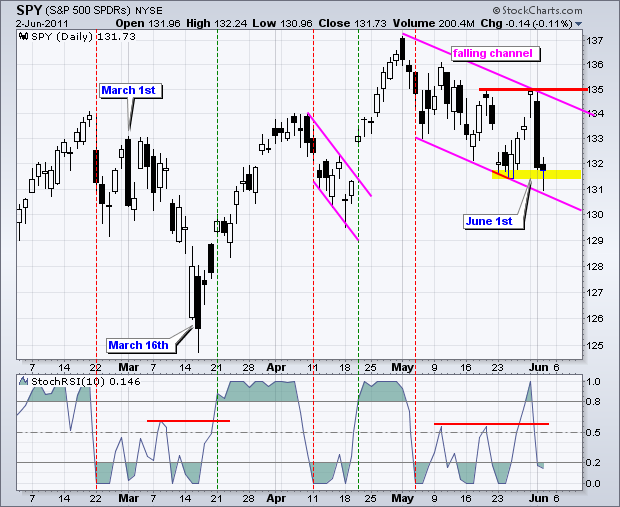
And now for the employment report... There is not much to do but wait for the market's reaction to the jobs number. On the daily chart, SPY is trading within a falling channel. The last reaction high formed with a hanging man and long black candlestick. This is the third long black candlestick in the last few months. SPY erased a four day advance with one big panic day down. Market participants became wary of the economic recovery after worse-than-expected reports on employment and manufacturing. We can also throw in a downgrade of Greek debt. While the medium-term trend remains up, the short-term downtrend was affirmed with this decline. SPY firmed near last week's low on Thursday and may just get an oversold bounce in the next day or two. A move above 135 is needed to fully reverse the short-term downtrend.

Key Economic Reports/Events:
Thu - Jun 02 - 08:30 - Jobless Claims
Thu - Jun 02 - 10:00 - Factory Orders
Thu - Jun 02 - 11:00 - Oil Inventories
Fri - Jun 03 - 08:30 – Employment Report
Fri - Jun 03 - 10:00 - ISM Services Index
Charts of Interest: Tuesday and Thursday in separate post.
This commentary and charts-of-interest are designed to stimulate thinking. This analysis is not a recommendation to buy, sell, hold or sell short any security (stock ETF or otherwise). We all need to think for ourselves when it comes to trading our own accounts. First, it is the only way to really learn. Second, we are the only ones responsible for our decisions. Think of these charts as food for further analysis. Before making a trade, it is important to have a plan. Plan the trade and trade the plan. Among other things, this includes setting a trigger level, a target area and a stop-loss level. It is also important to plan for three possible price movements: advance, decline or sideways. Have a plan for all three scenarios BEFORE making the trade. Consider possible holding times. And finally, look at overall market conditions and sector/industry performance.

