The Greek tragedy continues to drive the markets, and for good reason. EU leaders failed to come up with a definitive plan and the Greek parliament is set for a no confidence vote Tuesday. Should the Papandreou government survive this vote, another round of reforms will be pushed through and EU leaders will likely authorize another aid package. A lot hinges on this no-confidence vote, which means Tuesday could be a classic turnaround Tuesday, if even just for an oversold bounce in stocks that lasts a few weeks. All hell could break loose if the government does not win this vote and the EU fails to come up with a sufficient package. As if this Greek drama were not enough, we also have a Fed policy statement scheduled on Wednesday.
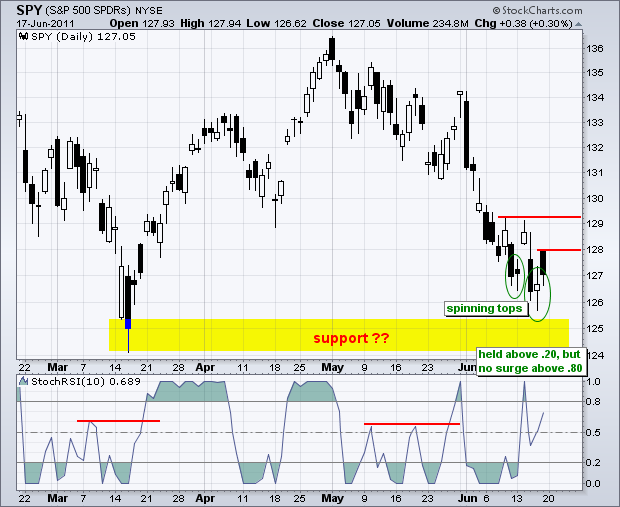
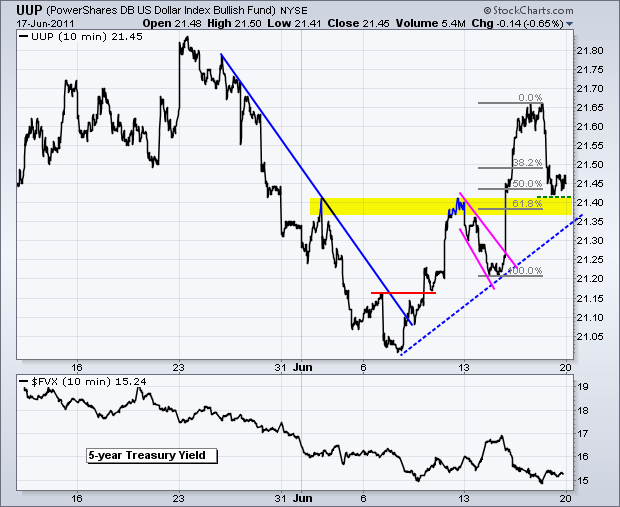
On the daily chart, the S&P 500 ETF (SPY) formed spinning top candlesticks on Monday and Thursday. There were even strong opens after these spinning tops, but buying pressure was not enough to sustain these gains and stocks fell back. We now have two resistance levels to work with over the short-term. A move above 128 would break Friday's opening high and likely push StochRSI above .80.
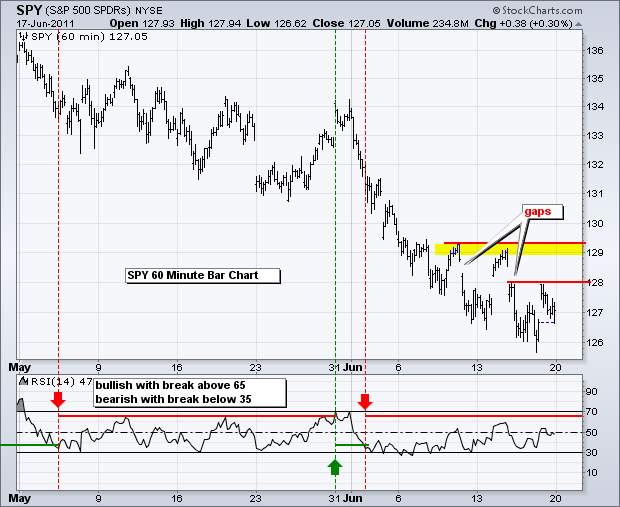
Until the Greek debt situation is resolved or the can is kicked down the road, US Treasuries are likely to benefit as money seeks the risk-off trade. The 30-year Treasury Yield ($TYX) is trading near support around 4.16% as the 20+ year Bond ETF (TLT) trades near resistance from the June highs. While breakouts would be technically bullish, bonds would likely be hit hard should the EU decide on an aid package for Greece. Tuesday could be a big day for bonds too.
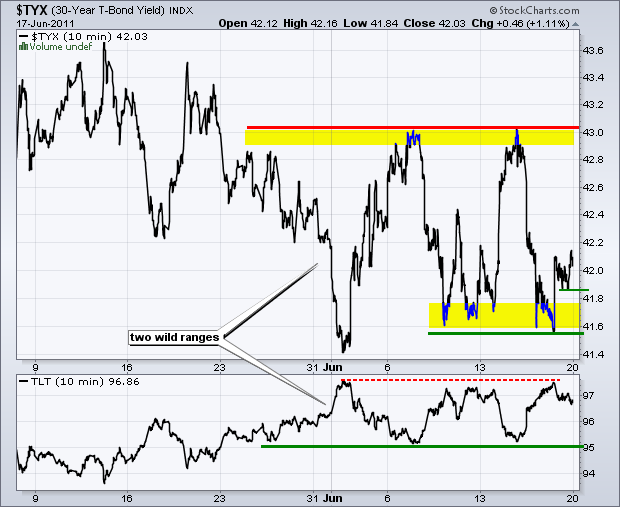
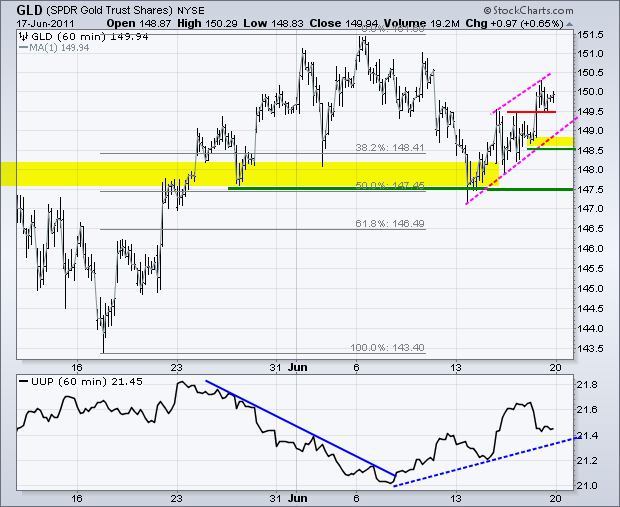
The US Dollar Fund (UUP) is also attracting money as an alternative to the Euro. After a sharp surge mid week, the ETF fell back on Friday with news of an EU aid package. UUP is currently at support from broken resistance and the 50-62% retracement zone. This is a good spot for a bounce.
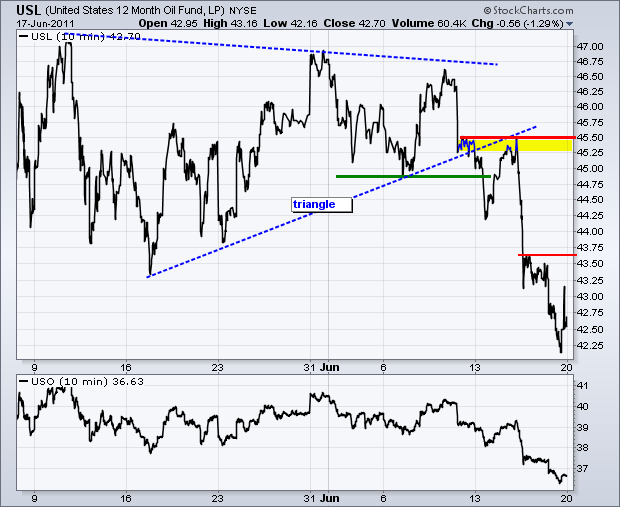
Oil remains remarkably weak as crude fell on Friday when stocks were up sharply. Even though the 12-Month US Oil Fund (USL) is oversold after a 10% high-low plunge this month, there are simply no buyers out there. A bounce in the Euro and the stock market would likely lead to a bounce in oil.
Gold does not care where the crisis is as long as there is a crisis somewhere. Gold attracts buyers when the Dollar is weak and even when the Euro is weak (Dollar strong). Notice that both gold and the Dollar moved higher last week. This is bearish for stocks. On the price chart, the Gold SPDR (GLD) remains within a rising channel or flag. The short-term trend is bullish as long as the flag rises. A break below 148.5 would reverse this rise and argue for another test of bigger support at 147.50.
Key Economic Reports/Events:
Jun 21 10:00 Existing Home Sales
Jun 22 07:00 MBA Mortgage Index
Jun 22 10:30 Oil Inventories
Jun 22 12:30 FOMC Policy Statement
Jun 23 08:30 Jobless Claims
Jun 23 10:00 New Home Sales
Jun 24 08:30 GDP
Jun 24 08:30 Durable Orders
Chart of Interest: Tuesday and Thursday in separate post.
This commentary and charts-of-interest are designed to stimulate thinking. This analysis is not a recommendation to buy, sell, hold or sell short any security (stock ETF or otherwise). We all need to think for ourselves when it comes to trading our own accounts. First, it is the only way to really learn. Second, we are the only ones responsible for our decisions. Think of these charts as food for further analysis. Before making a trade, it is important to have a plan. Plan the trade and trade the plan. Among other things, this includes setting a trigger level, a target area and a stop-loss level. It is also important to plan for three possible price movements: advance, decline or sideways. Have a plan for all three scenarios BEFORE making the trade. Consider possible holding times. And finally, look at overall market conditions and sector/industry performance.

