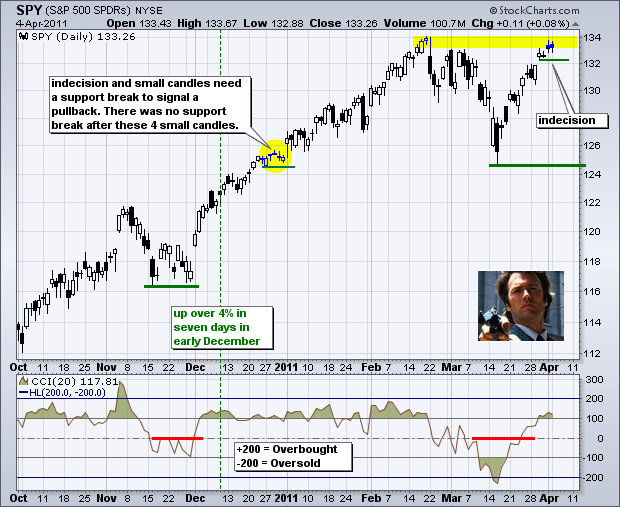
Clint Eastwood called this morning with a familiar question. Imagine the current uptrends speaking as Harry Calahan. Well, bear, do you feel lucky? Go ahead, bear, make my day. There is certainly a temptation to turn short-term bearish as SPY trades near resistance with overbought conditions. It is a risky top-pickers play because the overall trends are up with small-caps are leading the way. While the Russell 2000 ETF broke its February high, the S&P 500 ETF (SPY) has yet to follow suit. In this regard, SPY shows some relative weakness or a non-confirmation. I would, however, call this a relatively minor non-confirmation because SPY is less than 1 point from its February high. On the daily chart, the ETF is stalling with two small candlesticks. In fact, the candlesticks of the last four days have been quite small. This tells me that there has been little price movement after the open. The open-close range is small (body) and the high-low range is also small (shadows). Such indecision with SPY overbought and near resistance could lead to a short-term pullback. The late February lows established support around 130 and this area could mark support on any pullback.

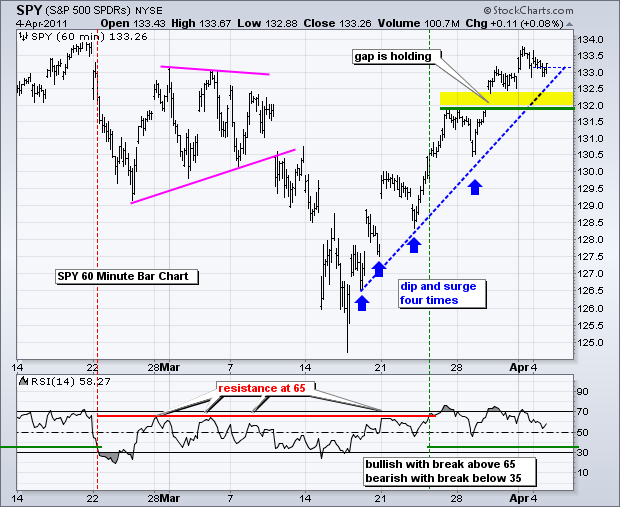
There is not much change on the 60-minute chart. The uptrend is clear as the ETF shows a steady progression of gaps, higher highs and higher lows since mid March. The last gap above 132 marks the first important support zone to watch. A move below this level would fill the gap and increase the chances of a deeper pullback. RSI remains in bull mode as it holds above 50. A move below 35 would turn short-term momentum bearish.

Key Economic Reports/Events:
Tue - Apr 05 - 10:00 - ISM Services
Tue - Apr 05 - 14:00 - Fed Minutes
Wed - Apr 06 - 07:00 - MBA Mortgage Index
Wed - Apr 06 - 10:30 - Oil Inventories
Thu - Apr 07 - 08:30 - Jobless Claims
Thu - Apr 07 - 15:00 - Consumer Credit
Fri - Apr 08 - 10:00 - Wholesale Inventories
Charts of Interest: Tuesday and Thursday in separate post.
-----------------------------------------------------------------------------
This commentary and charts-of-interest are designed to stimulate thinking. This analysis is not a recommendation to buy, sell, hold or sell short any security (stock ETF or otherwise). We all need to think for ourselves when it comes to trading our own accounts. First, it is the only way to really learn. Second, we are the only ones responsible for our decisions. Think of these charts as food for further analysis. Before making a trade, it is important to have a plan. Plan the trade and trade the plan. Among other things, this includes setting a trigger level, a target area and a stop-loss level. It is also important to plan for three possible price movements: advance, decline or sideways. Have a plan for all three scenarios BEFORE making the trade. Consider possible holding times. And finally, look at overall market conditions and sector/industry performance.
