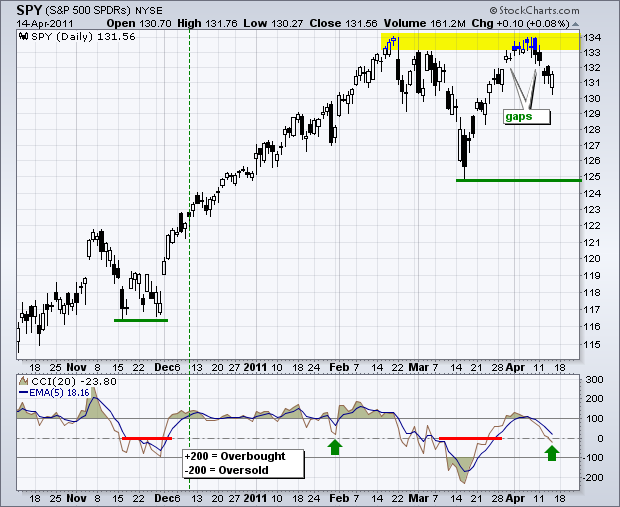
SPY managed to open weak and close strong, but has yet to fill Tuesday's gap and reverse the short-term downtrend. For now, the island reversal remains in play and has yet to be proven otherwise. CCI continues to drift lower and has yet to turn up. I overlaid a 5-day EMA to help identify an upturn in this momentum oscillator. Should SPY forge a reaction low in the 129-130 area and move back to the February-April highs, an inverse head-and-shoulders pattern would take shape. Within a bigger uptrend, these are bullish continuation patterns. A break above 134 would confirm the pattern and argue for further strength. This is still a long ways from confirmation, but it is something to think about going forward.
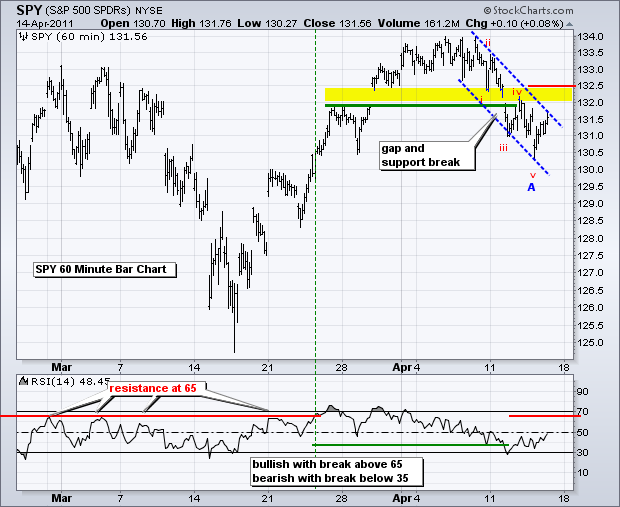
The decline over the last 6 days has traced out a clear 5-wave structure. We know that 5-wave moves are impulsive, which means the wave of one larger degree is down. The five wave decline shows the minute count (i,ii,iii,iv,v) and the bigger wave is marked with the blue A. Zigzag corrections start with a 5-wave sequence. The next leg would be a 3-wave bounce to form B and then a 5-wave decline to form C, which would complete the entire correction of the rally from mid March to early April. I will keep this count in the back of my head and gap resistance around 132-132.5 at the forefront. It is also possible that this decline is just a short-sharp falling flag and a break above 132.5 would signal a continuation of the prior advance. Anyway I slice it, the short-term trend is down with resistance at 132.5 holding the key.

Key Economic Reports/Events:
Fri - Apr 15 - 08:30 – Consumer Price Index
Fri - Apr 15 - 08:30 - Empire Manufacturing Index
Fri - Apr 15 - 09:15 - Industrial Production
Fri - Apr 15 - 09:55 - Michigan Sentiment
Charts of Interest: Tuesday and Thursday in separate post.
-----------------------------------------------------------------------------
This commentary and charts-of-interest are designed to stimulate thinking. This analysis is not a recommendation to buy, sell, hold or sell short any security (stock ETF or otherwise). We all need to think for ourselves when it comes to trading our own accounts. First, it is the only way to really learn. Second, we are the only ones responsible for our decisions. Think of these charts as food for further analysis. Before making a trade, it is important to have a plan. Plan the trade and trade the plan. Among other things, this includes setting a trigger level, a target area and a stop-loss level. It is also important to plan for three possible price movements: advance, decline or sideways. Have a plan for all three scenarios BEFORE making the trade. Consider possible holding times. And finally, look at overall market conditions and sector/industry performance.

