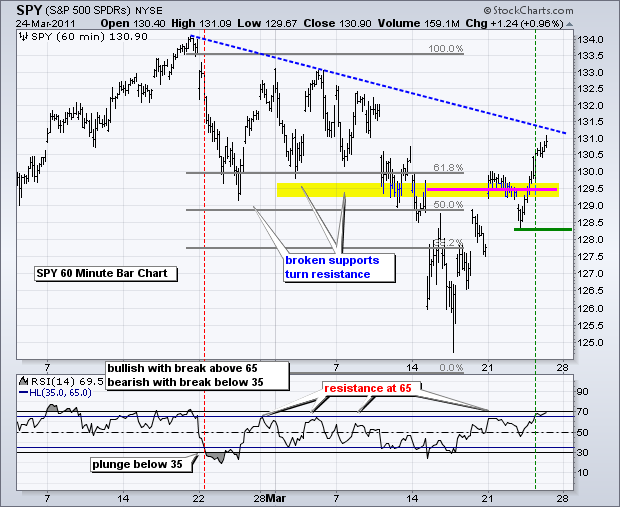
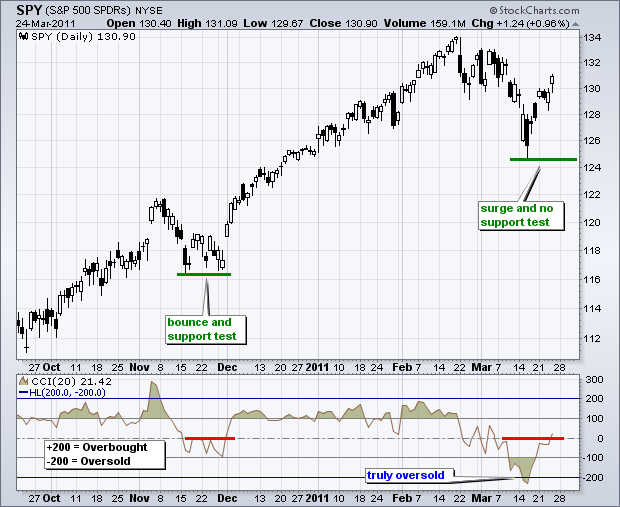
It was small-caps powering the market higher on Monday and techs powering stocks higher on Thursday. Even though these two key groups are playing tag-team, the market is benefitting from strength in both groups this week. As a result, the S&P 500 ETF (SPY) broke above short-term resistance and RSI moved above 65 for the first time since February 18th. Admittedly, SPY has already moved quite far from its March low (±5%). There is also possible resistance from the trendline extending down from the February high. However, there is always another potential resistance level if you look hard enough. At this point, the short-term trend is up with key support based on Wednesday's low. The ability to reverse after a gap down and forge a higher high is just testament to market strength.


Key Economic Reports/Events:
Fri - Mar 25 - 08:30 - GDP Estimate
Fri - Mar 25 - 09:55 - Michigan Sentiment
Charts of Interest: Tuesday and Thursday in separate post.
-----------------------------------------------------------------------------
This commentary and charts-of-interest are designed to stimulate thinking. This analysis is not a recommendation to buy, sell, hold or sell short any security (stock ETF or otherwise). We all need to think for ourselves when it comes to trading our own accounts. First, it is the only way to really learn. Second, we are the only ones responsible for our decisions. Think of these charts as food for further analysis. Before making a trade, it is important to have a plan. Plan the trade and trade the plan. Among other things, this includes setting a trigger level, a target area and a stop-loss level. It is also important to plan for three possible price movements: advance, decline or sideways. Have a plan for all three scenarios BEFORE making the trade. Consider possible holding times. And finally, look at overall market conditions and sector/industry performance.
