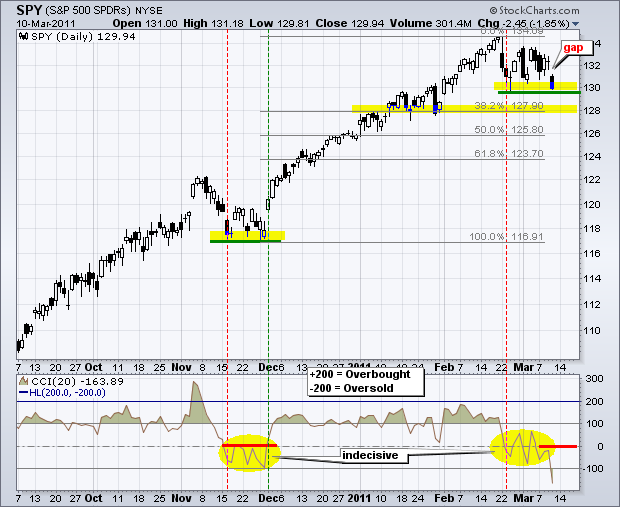
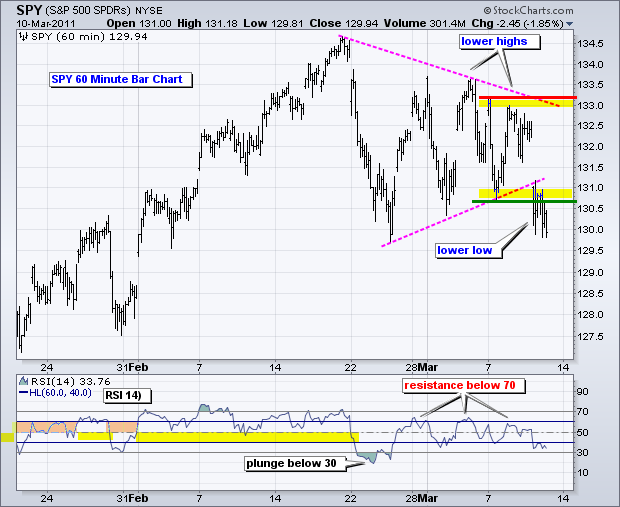
The final piece of the short-term puzzle finally came through as SPY broke support with a gap and sharp decline. RSI was already in bear mode after a plunge below 30 and three failures below 70. Breadth turned bearish on Monday as the 10-day SMAs for Net Advances (NYSE/Nasdaq) and Net Advancing Volume (NYSE/Nasdaq) all moved below -100 for the first time since mid November. SPY traced out a triangle as these indicators broke down. With a lower high forming in early March and now a break below the early March lows, it looks like a short-term downtrend is now underway. Because the medium-term trend is still up, this short-term downtrend is viewed as a correction within a bigger uptrend.

Key Economic Reports/Events:
Fri - Mar 11 - 08:30 - Retail Sales
Fri - Mar 11 - 09:55 - Michigan Sentiment
Fri - Mar 11 - 10:00 - Business Inventories
Charts of Interest: Tuesday and Thursday in separate post.
-----------------------------------------------------------------------------
This commentary and charts-of-interest are designed to stimulate thinking. This analysis is not a recommendation to buy, sell, hold or sell short any security (stock ETF or otherwise). We all need to think for ourselves when it comes to trading our own accounts. First, it is the only way to really learn. Second, we are the only ones responsible for our decisions. Think of these charts as food for further analysis. Before making a trade, it is important to have a plan. Plan the trade and trade the plan. Among other things, this includes setting a trigger level, a target area and a stop-loss level. It is also important to plan for three possible price movements: advance, decline or sideways. Have a plan for all three scenarios BEFORE making the trade. Consider possible holding times. And finally, look at overall market conditions and sector/industry performance.

