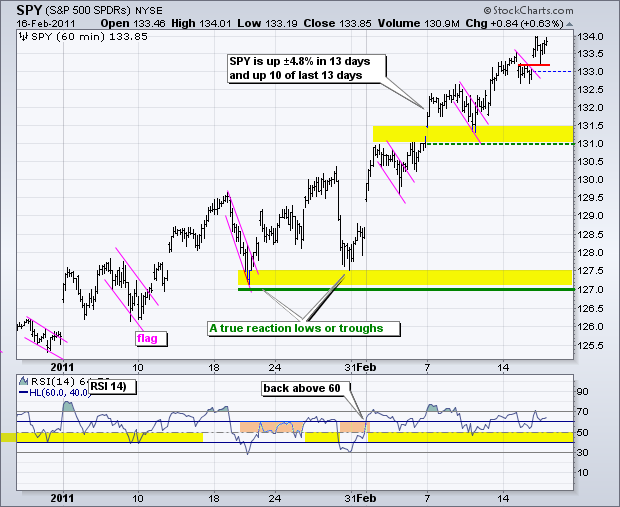
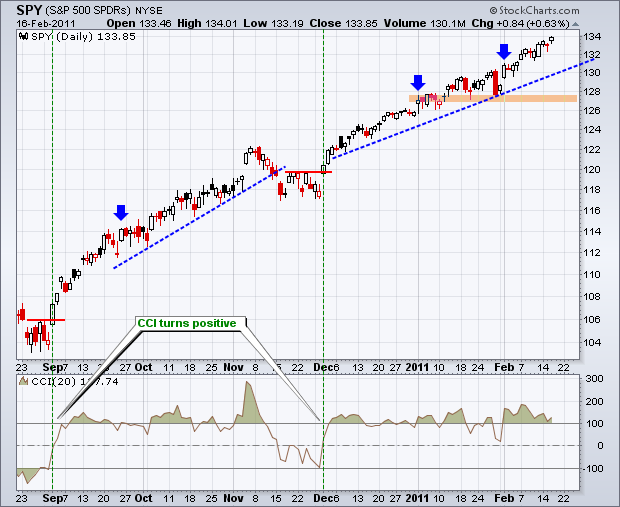
On the daily chart SPY surged on 1-Feb with a gap and long white candlestick that closed above 130. The advance continued after this surge with a grind higher. We can see bigger surge-grind patterns starting with the early September surge and the early December surge (green dotted lines). There are smaller surge-grind patterns after these surges (blue arrows). Picking a reversal point for these grinding advances is most difficult. There is often a sudden sharp decline without much warning, such as the decline from November 9 to 10 and one-day drop on January 28. Yes, you probably guessed it by now. There is really not much to say. The song remains the same: uptrends abound with no signs of significant selling pressure.

Key Economic Reports/Events:
Feb 17 - 08:30 - CPI
Feb 17 - 08:30 - Initial Claims
Feb 17 - 10:00 - Leading Indicators
Feb 17 - 10:00 - Philadelphia Fed
Charts of Interest: Tuesday and Thursday in separate post.
-----------------------------------------------------------------------------
This commentary and charts-of-interest are designed to stimulate thinking. This analysis is not a recommendation to buy, sell, hold or sell short any security (stock ETF or otherwise). We all need to think for ourselves when it comes to trading our own accounts. First, it is the only way to really learn. Second, we are the only ones responsible for our decisions. Think of these charts as food for further analysis. Before making a trade, it is important to have a plan. Plan the trade and trade the plan. Among other things, this includes setting a trigger level, a target area and a stop-loss level. It is also important to plan for three possible price movements: advance, decline or sideways. Have a plan for all three scenarios BEFORE making the trade. Consider possible holding times. And finally, look at overall market conditions and sector/industry performance.

