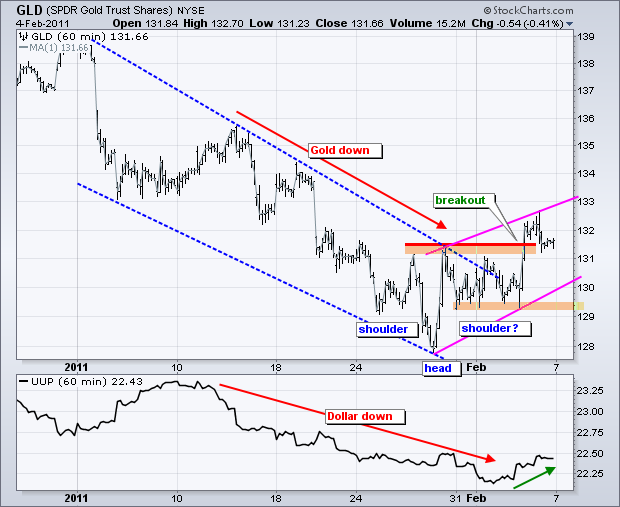
The Dollar/Gold relationship is a tough one to figure out these days. 2011 has seen both decline in January and bounce in February. The correlation this year appears to be largely positive, which is counter to the historically negative correlation. At times like these, it is often best to simply focus on the individual price charts. The first chart shows the Gold SPDR (GLD) breaking above channel resistance and exceeding neckline resistance from a small inverse head-and-shoulders pattern. This breakout reverses the short-term downtrend. At this point, I am now focused on what can prove this reversal otherwise. A rising wedge is currently taking shape. The bulls have the clear edge as long as this wedge rises. A move below the lower trendline would be a warning and a break below last week's low would reverse this short-term uptrend.
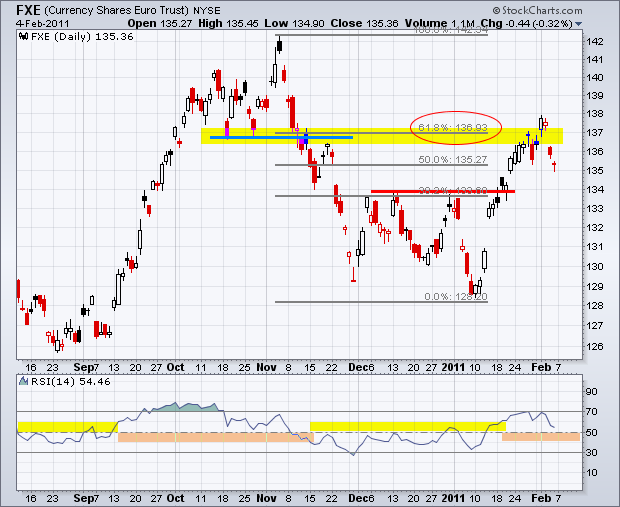
The Euro Currency Trust (FXE) took a big hit last week. I pointed out resistance from the 62% retracement and broken support in late January, but the Euro had other ideas with its surge above 137 last week. This surge, however, did not hold as the ETF closed below 135.5 on Friday. I still see lots of resistance in the 137 area. What is interesting is how gold surged as the Euro fell sharply. Gold seems to have a negative correlation with the Euro these days, which jibes with a positive Dollar correlation.
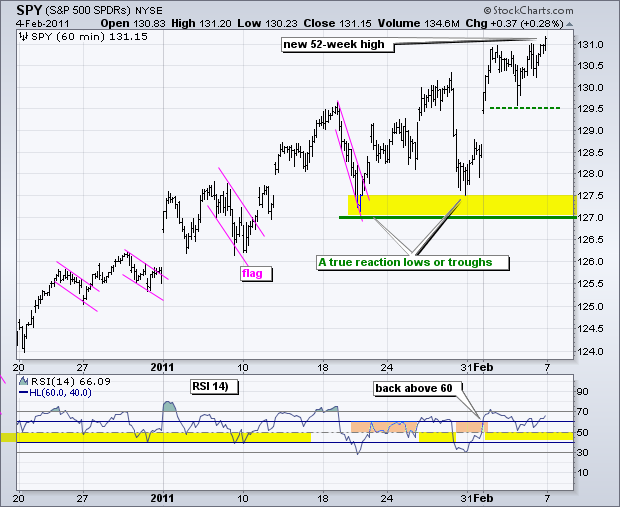
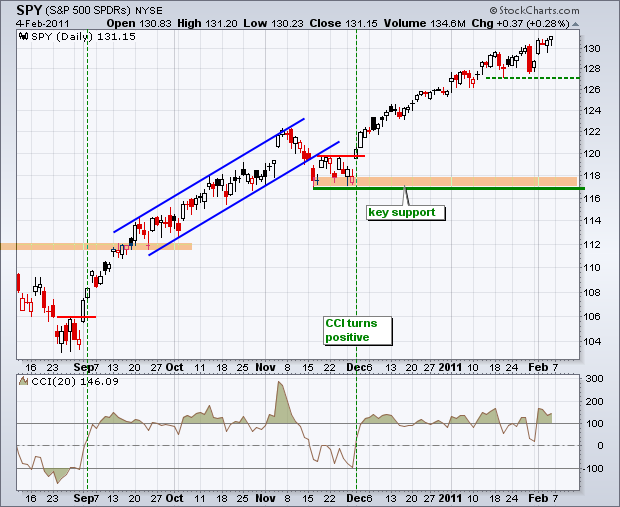
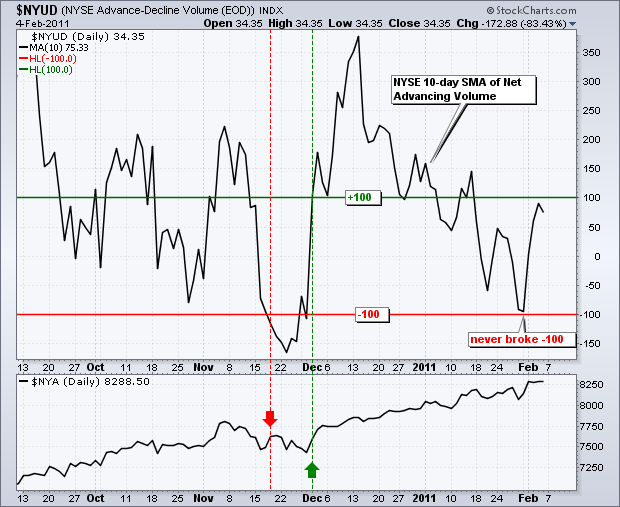
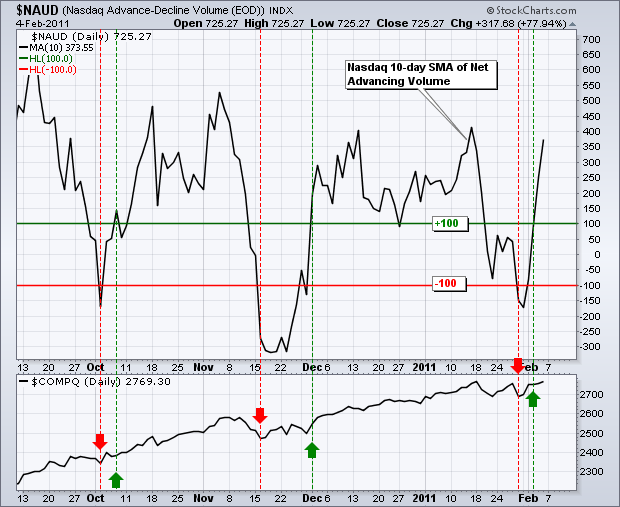
There is no change in the short-term situation for the stock market. SPY remains in a clear uptrend with higher highs and higher lows. The ETF gapped up on Monday and finished strong on Friday to record yet another 52-week high. Key support remains at 127 for now. Momentum is in bull mode as RSI broke above 60 on Monday. All four breadth indicators are also in bull mode. The 10-day SMAs for NYSE Net Advances ($NYAD) and NYSE Net Advancing Volume ($NYUD) moved above +100 in late November and have been bullish for over two months. The 10-day SMAs for Nasdaq Net Advances ($NAAD) and Nasdaq Net Advancing Volume ($NAUD) moved back above +100 last week to turn bullish again. Two of these breadth charts are shown below.
Key Economic Reports:
Wed - Feb 09 - 07:00 - MBA Mortgage Purchase Index
Wed - Feb 09 - 10:30 - Oil Inventories
Wed - Feb 09 - 18:45 – Bernanke Speaks
Thu - Feb 10 - 08:30 - Jobless Claims
Fri - Feb 11 - 09:55 - Michigan Sentiment
Charts of Interest: Tuesday and Thursday in separate post.
-----------------------------------------------------------------------------
This commentary and charts-of-interest are designed to stimulate thinking. This analysis is not a recommendation to buy, sell, hold or sell short any security (stock ETF or otherwise). We all need to think for ourselves when it comes to trading our own accounts. First, it is the only way to really learn. Second, we are the only ones responsible for our decisions. Think of these charts as food for further analysis. Before making a trade, it is important to have a plan. Plan the trade and trade the plan. Among other things, this includes setting a trigger level, a target area and a stop-loss level. It is also important to plan for three possible price movements: advance, decline or sideways. Have a plan for all three scenarios BEFORE making the trade. Consider possible holding times. And finally, look at overall market conditions and sector/industry performance.
