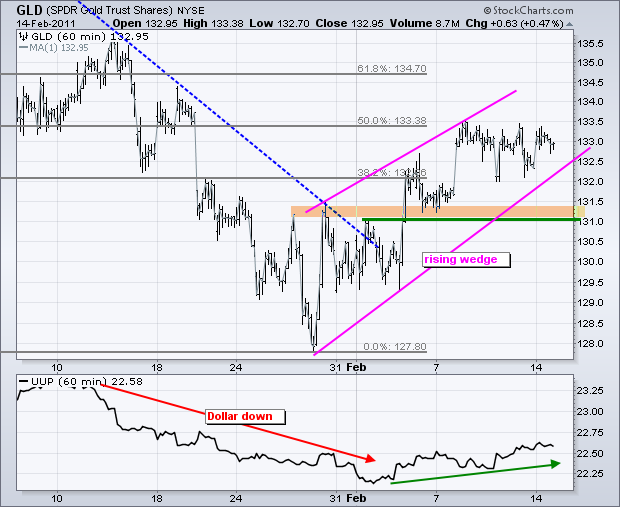
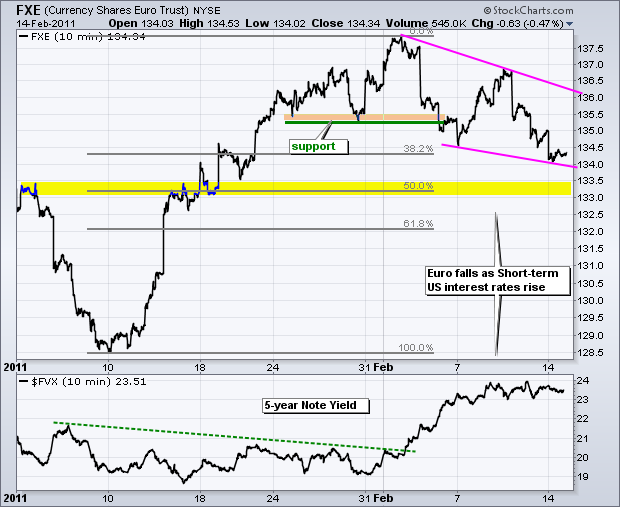
There are dueling wedges for the Euro Currency Trust (FXE) and the Gold SPDR (GLD). FXE remains in a downtrend with a falling wedge, while GLD remains in an uptrend with a rising wedge. FXE broke support the first week of February, formed a lower high last week and moved to a new low for the month. Should this decline continue, the next target is the 133-113.5 area, marked by broken resistance and the 50% retracement. Wedges are challenging because they are normally corrective patterns. However, the trend is clearly down as long as the wedge falls. Look for a break above 137 to fully reverse this decline. Short-term US interest rates may hold the key to the Dollar, and hence the Euro. Notice how the Euro declined as the 5-yr Treasury Yield ($FVX) surged in February. A decline in short-term rates could boost the Euro and weigh on the Dollar.

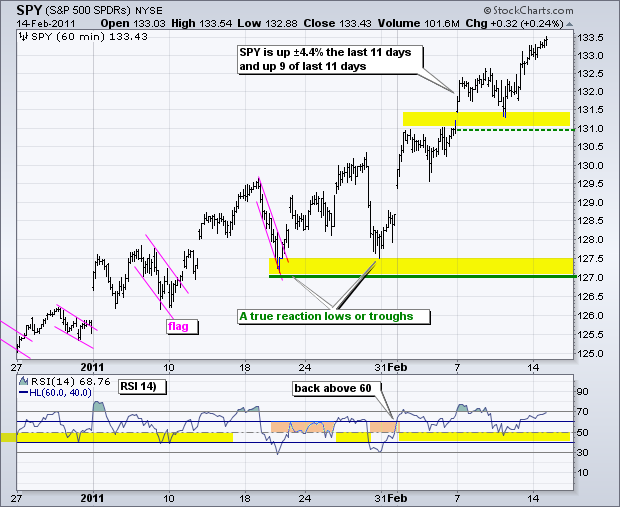
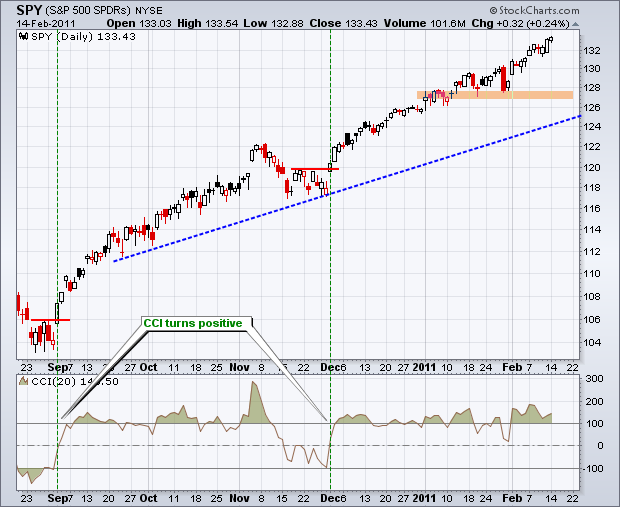
On the 60-minute chart, SPY gapped up the last two Monday's and both gaps held. The ETF is up around 4.4% the last eleven days and up nine of the last eleven days. Broken resistance and the gap mark the first support zone around 131-131.5. A move below this level would show the first sign of weakness. However, as we have seen recently, even the smallest dips bring out the buyers. RSI has been in bull mode since breaking above 60 ten days ago. Look for a move below 40 to turn momentum bearish.


Key Economic Reports/Events:
Feb 15 - 08:30 - Retail Sales
Feb 15 - 08:30 - Empire Manufacturing
Feb 15 - 10:00 - Business Inventories
Feb 15 - 10:00 - NAHB Housing Market Index
Feb 16 - 07:00 - MBA Mortgage Purchase Index
Feb 16 - 08:30 - Housing Starts/Building Permits
Feb 16 - 08:30 - PPI
Feb 16 - 09:15 - Industrial Production
Feb 16 - 10:30 - Crude Inventories
Feb 16 - 14:00 - Fed Minutes
Feb 17 - 08:30 - CPI
Feb 17 - 08:30 - Initial Claims
Feb 17 - 10:00 - Leading Indicators
Feb 17 - 10:00 - Philadelphia Fed
Charts of Interest: Tuesday and Thursday in separate post.
-----------------------------------------------------------------------------
This commentary and charts-of-interest are designed to stimulate thinking. This analysis is not a recommendation to buy, sell, hold or sell short any security (stock ETF or otherwise). We all need to think for ourselves when it comes to trading our own accounts. First, it is the only way to really learn. Second, we are the only ones responsible for our decisions. Think of these charts as food for further analysis. Before making a trade, it is important to have a plan. Plan the trade and trade the plan. Among other things, this includes setting a trigger level, a target area and a stop-loss level. It is also important to plan for three possible price movements: advance, decline or sideways. Have a plan for all three scenarios BEFORE making the trade. Consider possible holding times. And finally, look at overall market conditions and sector/industry performance.

