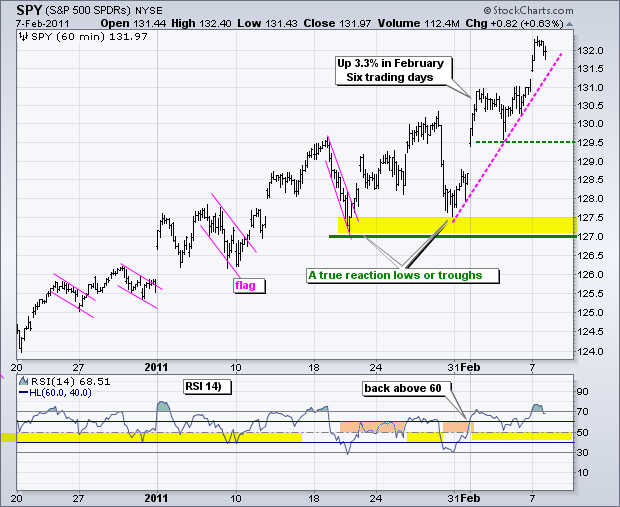
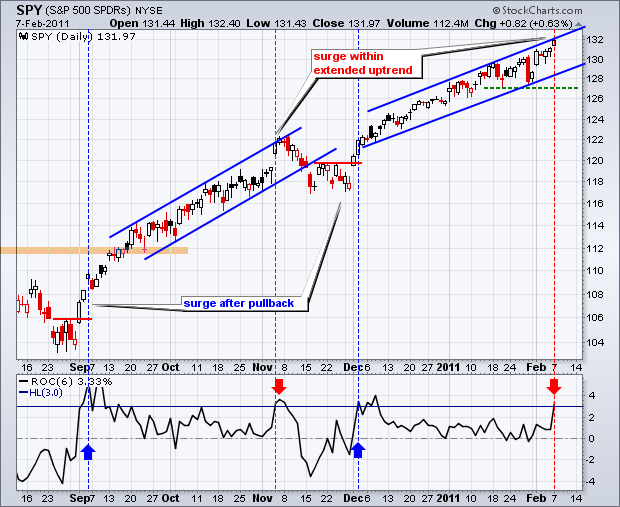
The S&P 500 ETF (SPY) is up 3.3% in the last six trading days or month-to-date. This is the sharpest 6-day advance since early December. There is, however, a big difference between the early December surge and the current surge. Looking back, I identified four times when the 6-day Rate-of-change indicator surged above 3% from zero or negative territory. The blue lines show surges occurring after a pullback. These surges signaled the start of a new leg higher. The early November surge occurred within an extended advance and foreshadowed the November correction. The current surge looks more like the early November surge, which was a buying climax of sorts. This is, of course, just the opposite of a selling climax. Also notice that SPY is trading near the upper trendline of a rising price channel. Yes, it looks like the bears have another Dirty Harry moment. Well, bear, do you feel lucky?!

Key Economic Reports:
Wed - Feb 09 - 07:00 - MBA Mortgage Purchase Index
Wed - Feb 09 - 10:30 - Oil Inventories
Wed - Feb 09 - 18:45 – Bernanke Speaks
Thu - Feb 10 - 08:30 - Jobless Claims
Fri - Feb 11 - 09:55 - Michigan Sentiment
Charts of Interest: Tuesday and Thursday in separate post.
-----------------------------------------------------------------------------
This commentary and charts-of-interest are designed to stimulate thinking. This analysis is not a recommendation to buy, sell, hold or sell short any security (stock ETF or otherwise). We all need to think for ourselves when it comes to trading our own accounts. First, it is the only way to really learn. Second, we are the only ones responsible for our decisions. Think of these charts as food for further analysis. Before making a trade, it is important to have a plan. Plan the trade and trade the plan. Among other things, this includes setting a trigger level, a target area and a stop-loss level. It is also important to plan for three possible price movements: advance, decline or sideways. Have a plan for all three scenarios BEFORE making the trade. Consider possible holding times. And finally, look at overall market conditions and sector/industry performance.

