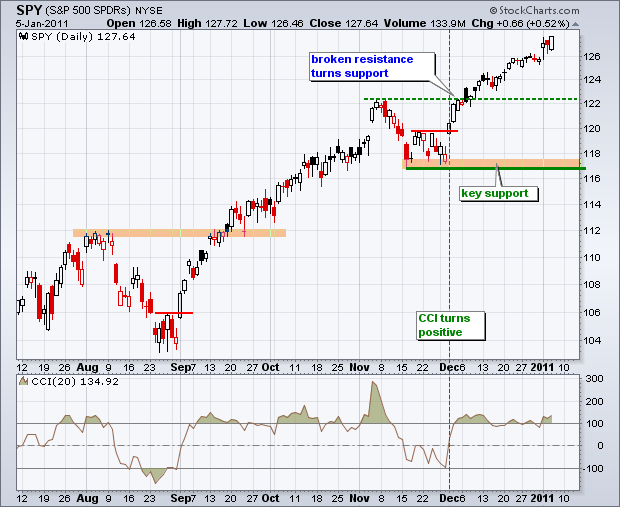
There is no change in the short-term or medium-term analysis. Medium-term, the daily chart shows SPY in a clear uptrend with a new 52-week high this week. The ETF is up some 7.6% since December and up 22% since August. These big gains make the ETF overbought by most yardsticks. As we have seen before, overbought is not necessarily bearish. Stocks can become overbought and remain overbought during strong uptrends. SPY was also overbought in mid September (±114), but continued on to 122 by early November. At this point, I will be watching short-term support on the 60-minute chart for signs of a reversal that would indicate a correction within this bigger uptrend.

Key Economic Reports:
Thu - Jan 06 - 08:30 - Jobless Claims
Fri - Jan 07 - 08:30 - Nonfarm Payrolls – Employment Report
Fri - Jan 07 - 10:00 – Bernanke Speaks
Charts of Interest: Tuesday and Thursday in separate post.
-----------------------------------------------------------------------------
This commentary and charts-of-interest are designed to stimulate thinking. This analysis is not a recommendation to buy, sell, hold or sell short any security (stock ETF or otherwise). We all need to think for ourselves when it comes to trading our own accounts. First, it is the only way to really learn. Second, we are the only ones responsible for our decisions. Think of these charts as food for further analysis. Before making a trade, it is important to have a plan. Plan the trade and trade the plan. Among other things, this includes setting a trigger level, a target area and a stop-loss level. It is also important to plan for three possible price movements: advance, decline or sideways. Have a plan for all three scenarios BEFORE making the trade. Consider possible holding times. And finally, look at overall market conditions and sector/industry performance.

