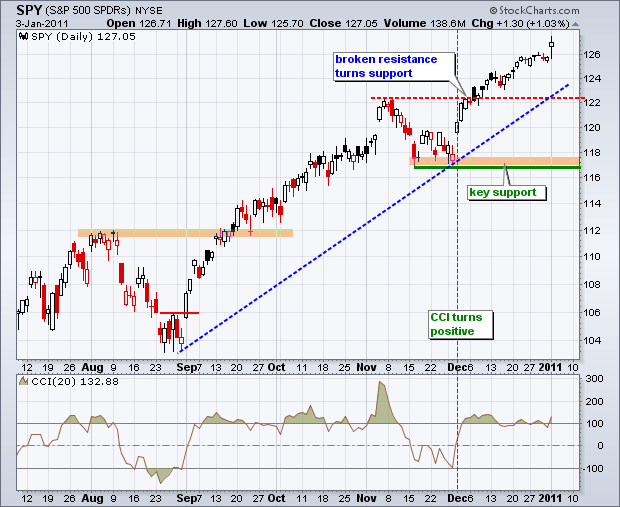
The bulls started January just like December as stocks surged on the open and remained at high levels throughout the day. The S&P 500 ETF (SPY) advanced just over 1% and recorded yet another 52-week high. SPY is now up 7.6% since the beginning of December. Even though there is no evidence of selling pressure or price weakness, this rally is clearly getting long on tooth (overextended). Stocks could become even further extended as new 2011 money is put to work in January. While I do not have an upside target, I can say that broken resistance and the late August trendline combine to mark the first support level around 122.
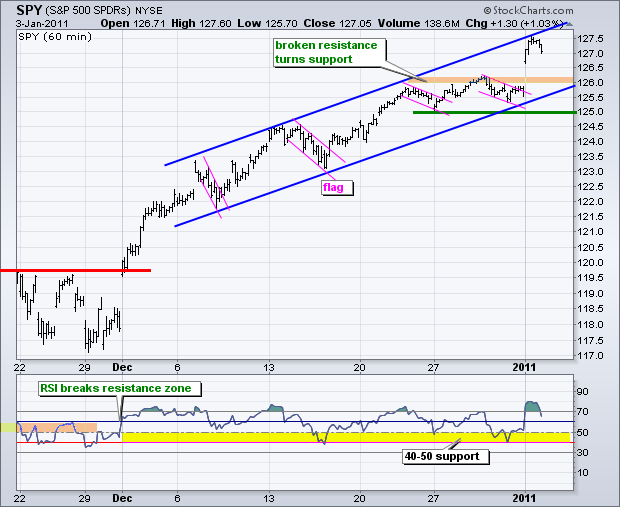
On the 60-minute chart, SPY gapped up and hit the upper trendline of the rising price channel around 127.5. The ETF pulled back after this initial surge, but still closed near the upper trendline. SPY is also short-term overbought and near channel resistance. I would not call this hard resistance because the bigger trend is up. Broken resistance and the lower trendline combine to mark the first short-term support level around 126.

Key Economic Reports:
Tue - Jan 04 - 10:00 - Factory Orders
Tue - Jan 04 - 14:00 - FOMC Minutes
Tue - Jan 04 - 15:00 - Auto-Truck Sales
Wed - Jan 05 - 07:00 - MBA Mortgage Purchase Index
Wed - Jan 05 - 08:15 - ADP Employment Change
Wed - Jan 05 - 10:00 - ISM Services
Wed - Jan 05 - 10:30 - Oil Inventories
Thu - Jan 06 - 08:30 - Jobless Claims
Fri - Jan 07 - 08:30 - Nonfarm Payrolls – Employment Report
Fri - Jan 07 - 10:00 – Bernanke Speaks
Charts of Interest: Tuesday and Thursday in separate post.
-----------------------------------------------------------------------------
This commentary and charts-of-interest are designed to stimulate thinking. This analysis is not a recommendation to buy, sell, hold or sell short any security (stock ETF or otherwise). We all need to think for ourselves when it comes to trading our own accounts. First, it is the only way to really learn. Second, we are the only ones responsible for our decisions. Think of these charts as food for further analysis. Before making a trade, it is important to have a plan. Plan the trade and trade the plan. Among other things, this includes setting a trigger level, a target area and a stop-loss level. It is also important to plan for three possible price movements: advance, decline or sideways. Have a plan for all three scenarios BEFORE making the trade. Consider possible holding times. And finally, look at overall market conditions and sector/industry performance.

About the author:
Arthur Hill, CMT, is the Chief Technical Strategist at TrendInvestorPro.com. Focusing predominantly on US equities and ETFs, his systematic approach of identifying trend, finding signals within the trend, and setting key price levels has made him an esteemed market technician. Arthur has written articles for numerous financial publications including Barrons and Stocks & Commodities Magazine. In addition to his Chartered Market Technician (CMT) designation, he holds an MBA from the Cass Business School at City University in London.
Learn More
