The bulk of the short-term evidence is bearish, but the medium-term evidence remains bullish. This means short-term weakness is viewed as a correction within a bigger uptrend. Keep in mind that this bigger uptrend holds the trump cards and these can be played at any time. There will most likely be some sort of bullish short-term signal to alert us of a short-term trend reversal.
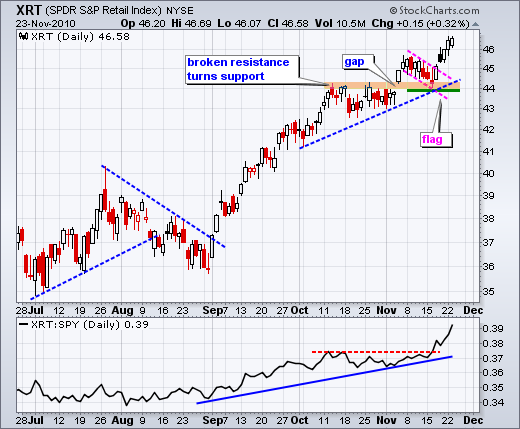
Stocks reacted to events in Euro-land and the Korean peninsula on Tuesday. In other words, events on either side of the oceans. Even though stocks were generally weak, the Retail SPDR (XRT) actually gained on the day. Retailers reflect events in the US. Frankly, relative strength in this group is a positive sign for the stock market, as it relative strength in semis.
On the daily chart, SPY gapped down on the open and stayed down throughout the day. Despite this weakness, selling pressure dried up after the initial decline and the ETF pretty much consolidated after the first hour. SPY now has another gap to fill. A move above this week's high would fill the gap and get the bulls moving again. In the indicator window, CCI hit resistance at the zero line and turned lower. A move back into positive territory would be bullish for momentum.

On the 60-minute chart, SPY has now produced three sizable gaps in the last six days. Trading is getting volatile. The first started with the support break last week. The second attempted to recapture this support break, but formed a lower high. The third occurred on Tuesday to signal a resumption of the short-term downtrend. It is possible that a falling channel is taking shape. The lower trendline extension projects further weakness to around 115.5-116 over the next few days. I am marking short-term resistance at 120. A move above this level and RSI break above 60 would reverse the short-term downtrend.

Key Economic Reports:
Wed - Nov 24 - 07:00 - MBA Mortgage Applications
Wed - Nov 24 - 08:30 - Personal Income
Wed - Nov 24 - 08:30 - Durable Orders
Wed - Nov 24 - 08:30 - Initial Claims
Wed - Nov 24 - 09:55 - Michigan Sentiment
Wed - Nov 24 - 10:00 - New Home Sales
Wed - Nov 24 - 10:30 - Crude Inventories
Thu – Nov 25 – 09:00 - Thanksgiving
Fri – Nov 26 – 09:00 – Market Closes at 1PM ET
Charts: Tuesday and Thursday in separate post.
-----------------------------------------------------------------------------
This commentary and charts-of-interest are designed to stimulate thinking. This analysis is not a recommendation to buy, sell, hold or sell short any security (stock ETF or otherwise). We all need to think for ourselves when it comes to trading our own accounts. First, it is the only way to really learn. Second, we are the only ones responsible for our decisions. Think of these charts as food for further analysis. Before making a trade, it is important to have a plan. Plan the trade and trade the plan. Among other things, this includes setting a trigger level, a target area and a stop-loss level. It is also important to plan for three possible price movements: advance, decline or sideways. Have a plan for all three scenarios BEFORE making the trade. Consider possible holding times. And finally, look at overall market conditions and sector/industry performance.

