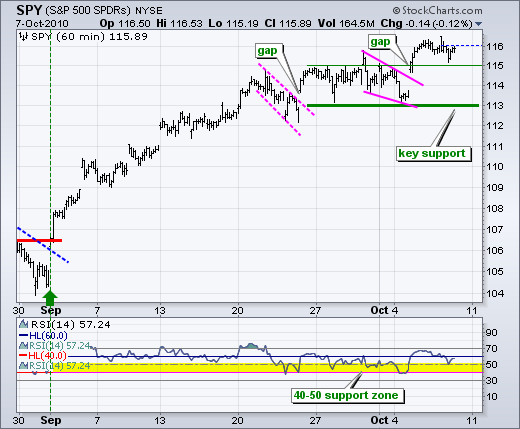
There is no change on the daily chart so I will go directly to the 60-minute chart. Whether or not SPY holds its breakout depends on the market's reaction to the employment report. The news is not what is important here. It is the market's reaction to the news. A decline on "good news" would be bearish. An advance on "bad news" would be bullish. Broken resistance at 115 turns into the first support level to watch for signs of cold feet (hooves). A break below this level would provide the first sign of weakness, but it would not be enough to fully reverse the short-term uptrend, which has been in force since September 1st (green arrow). I will still wait for a decisive break below 113 in SPY and 40 in RSI before turning short-term bearish.

Key Economic Reports: Friday - Oct 08 - 08:30 – Employment Report
-----------------------------------------------------------------------------
This commentary and charts-of-interest are designed to stimulate thinking. This analysis is not a recommendation to buy, sell, hold or sell short any security (stock ETF or otherwise). We all need to think for ourselves when it comes to trading our own accounts. First, it is the only way to really learn. Second, we are the only ones responsible for our decisions. Think of these charts as food for further analysis. Before making a trade, it is important to have a plan. Plan the trade and trade the plan. Among other things, this includes setting a trigger level, a target area and a stop-loss level. It is also important to plan for three possible price movements: advance, decline or sideways. Have a plan for all three scenarios BEFORE making the trade. Consider possible holding times. And finally, look at overall market conditions and sector/industry performance.
