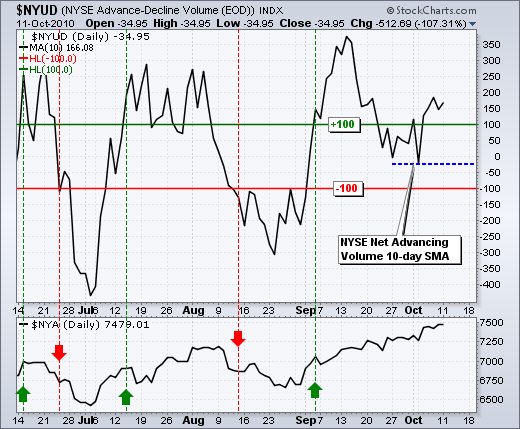
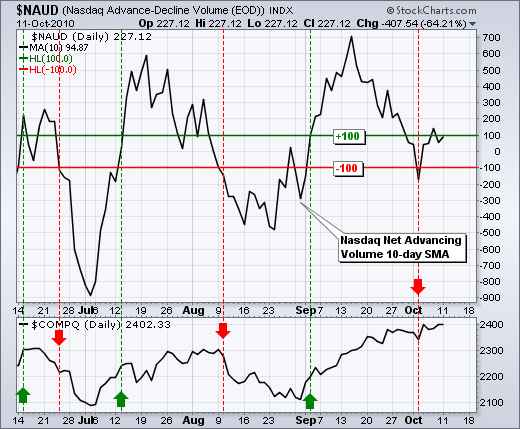
A review of my short-term indicators confirms short-term uptrend, but there are some signs that the advancing is tiring. In particular, the 10-day SMA for Net Advancing Volume shows some weakness over the last two weeks. The charts below show this indicator for the NYSE and Nasdaq. The green line is set at +100 and the red line at -100. A move above +100 is short-term bullish, while a move below -100 is short-term bearish. I placed these signal lines just above/below the zero line to limit whipsaw signals. The NYSE and Nasdaq lines triggered bullish signals the first week of September with a big surge. The NYSE indicator remains on a bull signal, but the Nasdaq indicator dipped below -100 early last week. This shows an unusual amount of selling pressure. The indicator is not immune to whipsaws so I will be watching for a confirming signal. Should both indicators break below last week's lows, we would have short-term bearish signals for breadth.


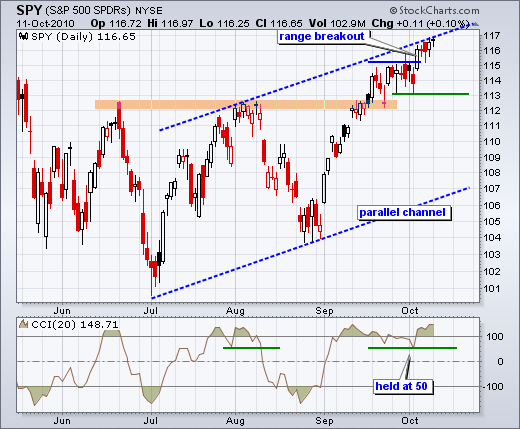
There is no change on the daily chart. SPY is up around 12% from its late August low. This 6-week run started with a higher low and carried the ETF above the early August high. A clear zigzag higher defines the overall uptrend. Even though the trend is clearly up, the ETF is still overextended on the upside because we have yet to see a meaningful pullback. Picking resistance is difficult with such a strong uptrend, but it is possible that the upper trendline of a rising price channel marks some resistance around 117. Even with potential resistance and slowing momentum, the overall trend remains up with no signs of weakness. I am marking daily chart support at 113 and CCI support at 50.

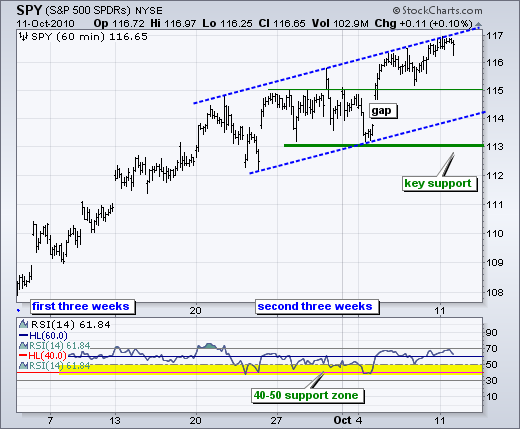
No change. The 60-minute chart shows two distinct periods for this advance. SPY moved from 104 to 113 (+9.1%) the first three weeks and from 113 to 116.5 (3.1%) the second three weeks. Upside momentum has slowed significantly the last three weeks as the ETF formed a rising channel. Despite slowing momentum, SPY continues to trace out a series of higher highs and higher lows as it grinds higher. A move below the channel trendline and the last reaction low at 113 would fully reverse this uptrend. RSI support remains in the 40-50 zone and a move below 40 would turn momentum bearish. Those looking for an early sign can turn to broken resistance around 115, which turns into the first support level.

Key Economic Reports:
Oct 12 - 14:00 - September FOMC Minutes
Oct 13 - 07:00 - MBA Mortgage Applications
Oct 13 - 10:30 - Oil Inventories
Oct 14 - 08:30 - Jobless Claims
Oct 14 - 08:30 - PPI
Oct 15 - 08:15 - Ben Bernanke Speaks
Oct 15 - 08:30 - CPI
Oct 15 - 08:30 - Retail Sales
Oct 15 - 08:30 - NY Fed Empire Manufacturing Survey
Oct 15 - 09:55 - Michigan Sentiment
Charts of Interest: Separate Post.
-----------------------------------------------------------------------------
This commentary and charts-of-interest are designed to stimulate thinking. This analysis is not a recommendation to buy, sell, hold or sell short any security (stock ETF or otherwise). We all need to think for ourselves when it comes to trading our own accounts. First, it is the only way to really learn. Second, we are the only ones responsible for our decisions. Think of these charts as food for further analysis. Before making a trade, it is important to have a plan. Plan the trade and trade the plan. Among other things, this includes setting a trigger level, a target area and a stop-loss level. It is also important to plan for three possible price movements: advance, decline or sideways. Have a plan for all three scenarios BEFORE making the trade. Consider possible holding times. And finally, look at overall market conditions and sector/industry performance.
