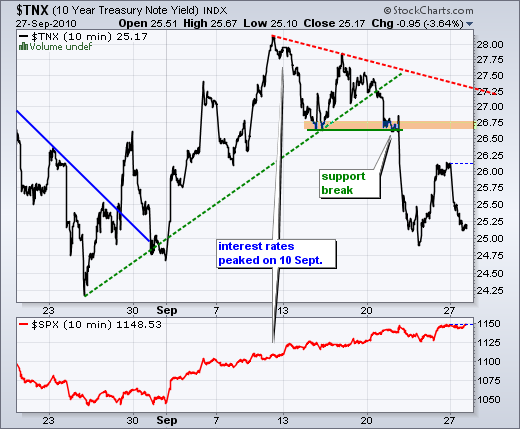
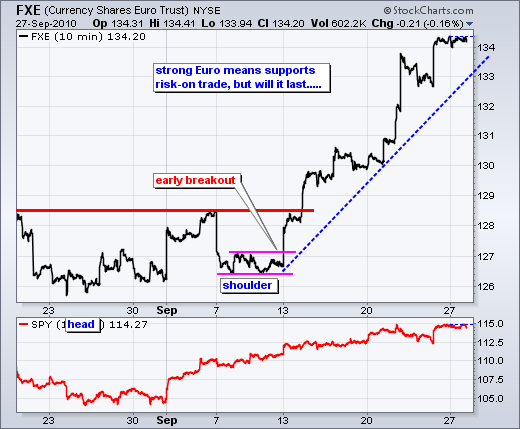
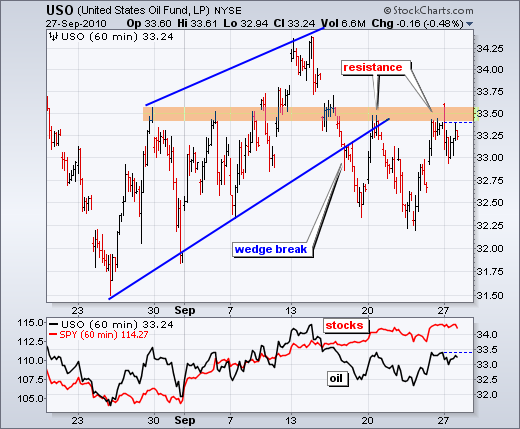
The risk-on trade remains in force, but the bullish case has been weakening since last week. Even though the Euro remains in clear uptrend, supporting the risk-on trade, the 10-year Treasury Yield ($TNX) remains in a downtrend and fell further on Monday. In addition, the Finance SPDR (XLF) was hit hard last week. After a rebound with the market on Friday, XLF fell sharply again on Monday. Oil also benefits from the risk-on trade, but the USO Oil Fund (USO) has not been keeping up with SPY since mid September. SPY hit a new high this week and USO remains well below its mid September high. Falling interest rates, rising bond prices and weakness in oil argue for caution towards equities (risk-off). However, stocks show no signs of weakness just yet.
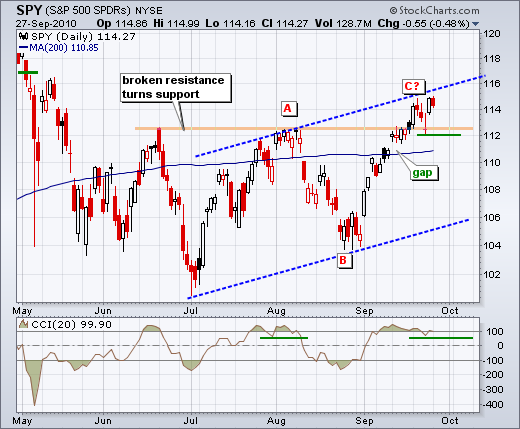
Stocks stalled on Monday with a bout of selling pressure hitting the market in the final hour. Even though the trend is clearly up here, I am leaving the ABC correction possibility on the chart. In addition, the upper trendline was drawn parallel to the lower trendline and its extension marks potential resistance around 115. CCI remains in the indicator window. Notice that CCI dipped below 100 at the end of July and then moved back above in early August. A little reaction low established momentum support at 50. The break below this low in early August coincided with the August decline. A similar low formed in CCI this week. A move below 112 in the ETF and 50 in CCI could be used as a short-term bearish trigger.
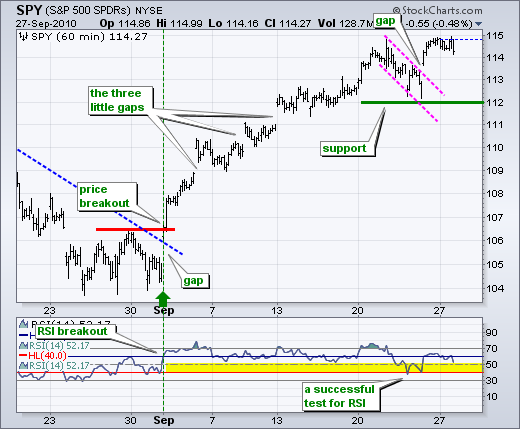
On the 60-minute chart, SPY formed a falling flag last week and broke above flag resistance with a gap up on Friday. The gap held and remains bullish until proven otherwise. Support at 112 has been affirmed, as has RSI support in the 40-50 zone. Look for a break below 112 in SPY and 40 in RSI to reverse this short-term uptrend.
It is a pretty big week on the economic front, especially on Friday. Fed governor speaks on Friday morning and the market gets hit with Michigan sentiment, construction spending and the ISM Index around 10AM.
Key Economic Reports:
Tue - Sep 28 - 09:00 - Case-Shiller Index
Tue - Sep 28 - 10:00 - Consumer Confidence
Wed - Sep 29 - 10:30 - Oil Inventories
Thu - Sep 30 - 08:30 - GDP Estimate
Thu - Sep 30 - 08:30 - Jobless Claims
Thu - Sep 30 - 09:45 - Chicago PMI
Thu - Sep 30 - 16:30 – Fed Balance Sheet
Fri - Oct 01 - 08:30 - Personal Income an Spending
Fri - Oct 01 - 09:55 - Michigan Consumer Sentiment
Fri - Oct 01 - 10:00 - Construction Spending
Fri - Oct 01 - 10:00 - ISM Index
Fri - Oct 01 - 14:00 - Auto Truck Sales
