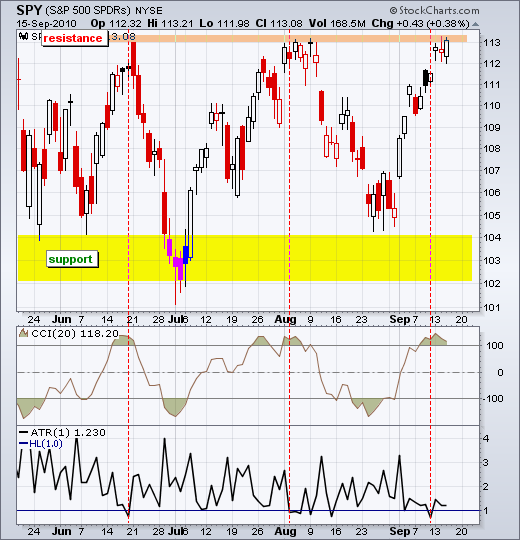
After a weak open, buyers came into the market and pushed stocks higher with a little pop coming in the final hour. There seems to be some performance anxiety creeping into the market as the major indices trade well above their August lows. There is not much change in the overall picture as SPY remains short-term overbought and at resistance. Tuesday, I noted the S&P 500 Volatility Index ($VIX) moving below its lower Bollinger Band on 3-Sept and the narrow range day on 10-Sept. These are warnings, but we have yet to see a short-term reversal, such as a filling of Monday's gap. What's more, I think everyone and their dog is aware of the situation (overbought, at resistance, etc...). Can we profit from something some many people see? Remember the Hindenburg Omen? At this point, I will remain bullish as long as Monday's gap holds.

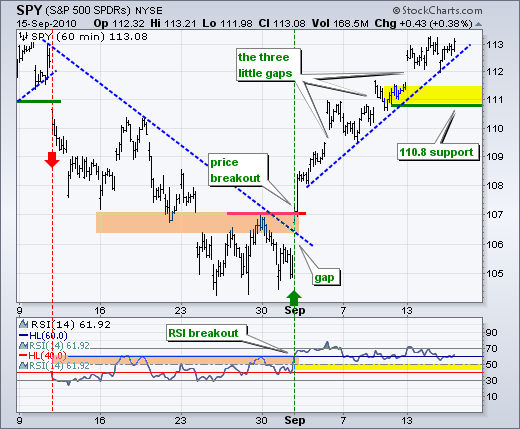
On the 60-minute chart, support is now based on broken resistance around 111, the little consolidation and Monday's gap. The early August stall traded in a 2 point range (111 to 113). Therefore, I would like to give the market a little wiggle room. With performance anxiety eating at portfolio managers, little dips may be enough to entice the bulls. The trick is to identify a dip big enough to result in an actual trend reversal. A move below 110.8 in SPY and 40 in RSI would be enough to reverse the short-term uptrend.
Key Economic Reports:
Thu - Sep 16 - 08:30 - Jobless Claims
Thu - Sep 16 - 08:30 - PPI
Thu - Sep 16 - 10:00 - Philadelphia Fed
Thu - Sep 16 - 16:30 - Fed Balance Sheet
Fri - Sep 17 - 08:30 - CPI
Fri - Sep 17 - 09:55 - Michigan Sentiment
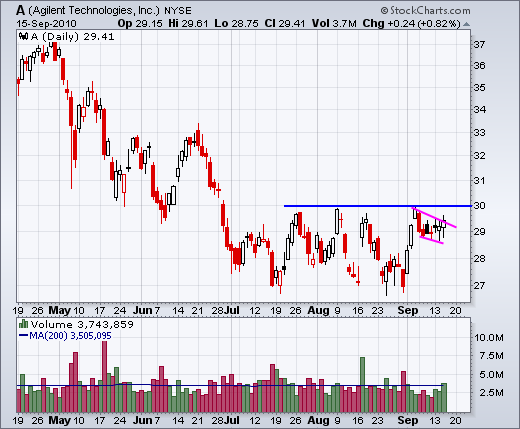
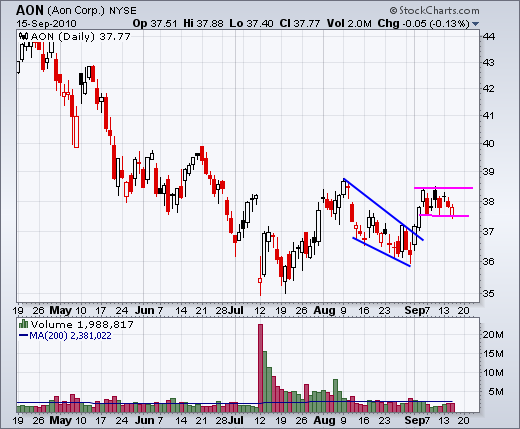
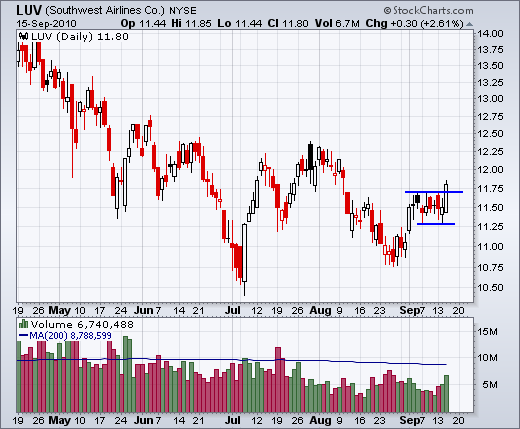
Charts of Interest: A, AON, BAX, CVH, GR, IMN, LUV
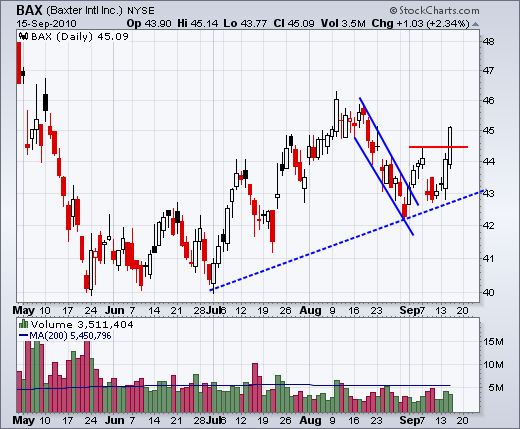
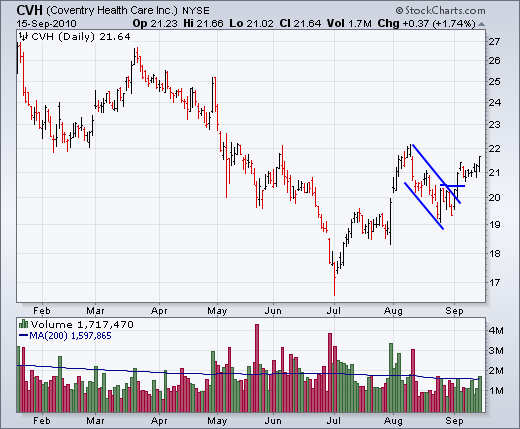
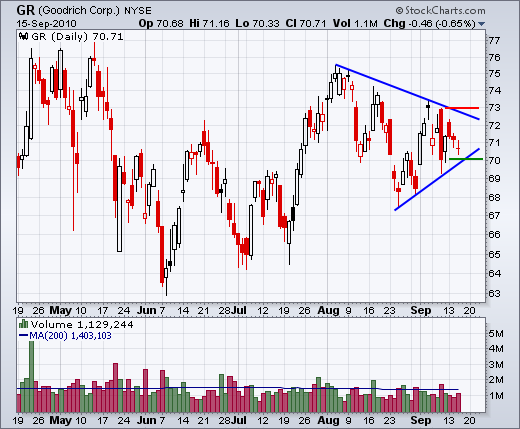
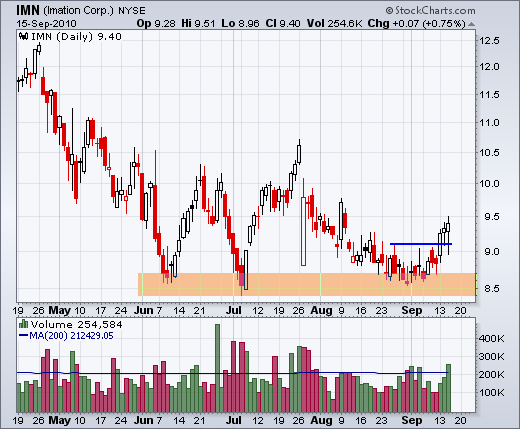
This commentary and charts-of-interest are designed to stimulate thinking. This analysis is not a recommendation to buy, sell, hold or sell short any security (stock ETF or otherwise). We all need to think for ourselves when it comes to trading our own accounts. First, it is the only way to really learn. Second, we are the only ones responsible for our decisions. Think of these charts as food for further analysis. Before making a trade, it is important to have a plan. Plan the trade and trade the plan. Among other things, this includes setting a trigger level, a target area and a stop-loss level. It is also important to plan for three possible price movements: advance, decline or sideways. Have a plan for all three scenarios BEFORE making the trade. Consider possible holding times. And finally, look at overall market conditions and sector/industry performance.

About the author:
Arthur Hill, CMT, is the Chief Technical Strategist at TrendInvestorPro.com. Focusing predominantly on US equities and ETFs, his systematic approach of identifying trend, finding signals within the trend, and setting key price levels has made him an esteemed market technician. Arthur has written articles for numerous financial publications including Barrons and Stocks & Commodities Magazine. In addition to his Chartered Market Technician (CMT) designation, he holds an MBA from the Cass Business School at City University in London.
Learn More