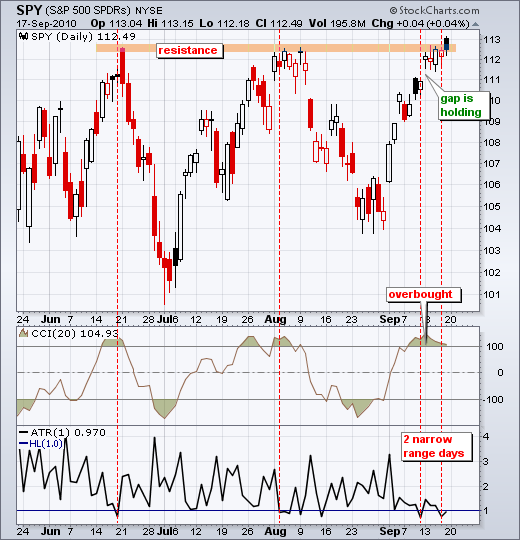
There is not much change on the daily chart as we head towards the Fed policy statement on Tuesday. Even though no major policy changes are expected, we cannot not rule volatility on Tuesday afternoon. After churning around 112 the prior four days, SPY opened above 113 with a gap on Friday morning. There was no follow through as the ETF moved lower after the open and closed back in the prior range. We are right back where we started the week: overbought at resistance. Stalling is not the same as weakness. At this point, the ETF has worked off some of the overbought conditions that existed since late Monday. Monday's gap holds the first key. So far this gap is holding and SPY shows no sigs of weakness. The bulls still have the edge and we could even see a breakout this week. But will it hold?


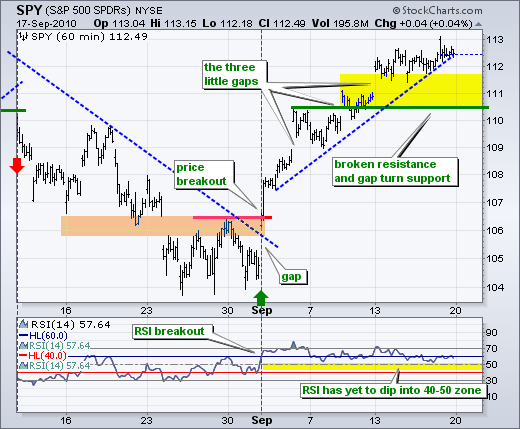
There is no change on the 60-minute chart. Support is based on broken resistance around 111, the little consolidation and last Monday's gap. The early August stall traded in a 2 point range (111 to 113). Therefore, I would like to give the market a little wiggle room. With performance anxiety eating at portfolio managers, little dips may be enough to entice the bulls. The trick is to identify a dip big enough to result in an actual trend reversal. A move below 110.8 in SPY and 40 in RSI would be enough to reverse this short-term uptrend.

It's Fed week and there are several housing market indicators on deck, four to be exact. Tuesday trading could flatten out heading into the Fed policy statement. Come to think of it, trading has been flattening out for a week now. Volatility usually surges just before and after the statement. Sometimes there are false moves or break outs that are reversed when cooler heads prevail on Wednesday morning.
Key Economic Reports:
Mon - Sep 20 - 10:00 - Housing Market Index
Tue - Sep 21 - 08:30 - Housing Starts
Tue – Sep 21 – 14:15 - FOMC Rate Decision
Wed - Sep 22 - 10:30 – Oil Inventories
Thu - Sep 23 - 08:30 - Initial Claims
Thu - Sep 23 - 10:00 - Existing Home Sales
Thu - Sep 23 - 10:00 - Leading Indicators
Thu - Sep 23 - 13:00 – Volcker speaks
Fri - Sep 24 - 08:30 - Durable Orders
Fri - Sep 24 - 10:00 - New Home Sales
Fri - Sep 24 - 10:00 – Fed governors Lacker and Plosser speak
Charts of Interest: Tuesday and Thursday.
This commentary and charts-of-interest are designed to stimulate thinking. This analysis is not a recommendation to buy, sell, hold or sell short any security (stock ETF or otherwise). We all need to think for ourselves when it comes to trading our own accounts. First, it is the only way to really learn. Second, we are the only ones responsible for our decisions. Think of these charts as food for further analysis. Before making a trade, it is important to have a plan. Plan the trade and trade the plan. Among other things, this includes setting a trigger level, a target area and a stop-loss level. It is also important to plan for three possible price movements: advance, decline or sideways. Have a plan for all three scenarios BEFORE making the trade. Consider possible holding times. And finally, look at overall market conditions and sector/industry performance.

About the author:
Arthur Hill, CMT, is the Chief Technical Strategist at TrendInvestorPro.com. Focusing predominantly on US equities and ETFs, his systematic approach of identifying trend, finding signals within the trend, and setting key price levels has made him an esteemed market technician. Arthur has written articles for numerous financial publications including Barrons and Stocks & Commodities Magazine. In addition to his Chartered Market Technician (CMT) designation, he holds an MBA from the Cass Business School at City University in London.
Learn More