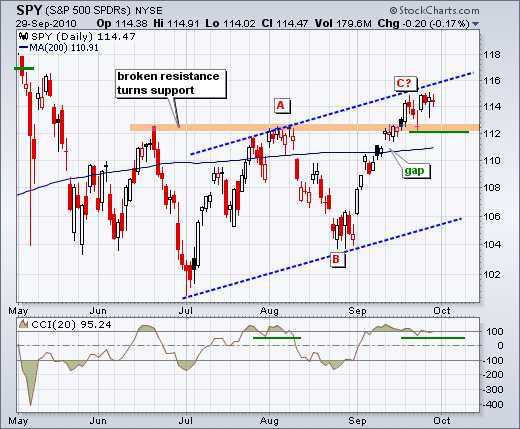
There is no change on the daily chart. SPY continues to stall around 114 and has yet to break support. Even though the trend is clearly up here, I am leaving the ABC correction possibility on the chart. SPY is also near channel resistance and overbought. The upper trendline of the channel was drawn parallel to the lower trendline and its extension marks potential resistance around 115. CCI remains in the indicator window. Notice that CCI dipped below 100 at the end of July and then moved back above in early August. A little reaction low established momentum support at 50. The break below this low in early August coincided with the August decline. A similar low formed in CCI this week. A move below 112 in the ETF and 50 in CCI could be used as a bearish trigger on the daily chart.

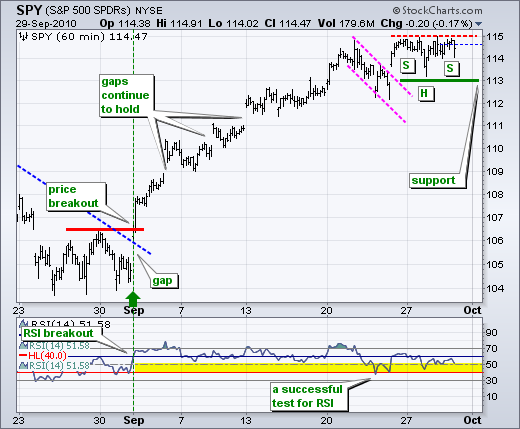
On the 60-minute chart, SPY traced out a very small inverse head-and-shoulders pattern this week. The pattern is best seen on a 10 or 15 minute chart. The Monday-Friday consolidation below 115 marks the left shoulder, Tuesday's low forms the head and the Wednesday consolidation marks the right shoulder. A break above this week's high would keep the rally going and argue for a few more points. Overall, SPY found support in the gap zone marking the flag breakout last Friday. This reaction low now marks key support. A move below 113 in SPY and 40 in RSI would reverse the short-term uptrend and call for at least a correction of the September advance.

It is a pretty big week on the economic front, especially on Friday. Fed governor speaks on Friday morning and the market gets hit with Michigan sentiment, construction spending and the ISM Index around 10AM.
Key Economic Reports:
Thu - Sep 30 - 08:30 - GDP Estimate
Thu - Sep 30 - 08:30 - Jobless Claims
Thu - Sep 30 - 09:45 - Chicago PMI
Thu - Sep 30 - 16:30 – Fed Balance Sheet
Fri - Oct 01 - 08:30 - Personal Income an Spending
Fri - Oct 01 - 09:55 - Michigan Consumer Sentiment
Fri - Oct 01 - 10:00 - Construction Spending
Fri - Oct 01 - 10:00 - ISM Index
Fri - Oct 01 - 14:00 - Auto Truck Sales
Charts of Interest: Separate post.
-----------------------------------------------------------------------------
This commentary and charts-of-interest are designed to stimulate thinking. This analysis is not a recommendation to buy, sell, hold or sell short any security (stock ETF or otherwise). We all need to think for ourselves when it comes to trading our own accounts. First, it is the only way to really learn. Second, we are the only ones responsible for our decisions. Think of these charts as food for further analysis. Before making a trade, it is important to have a plan. Plan the trade and trade the plan. Among other things, this includes setting a trigger level, a target area and a stop-loss level. It is also important to plan for three possible price movements: advance, decline or sideways. Have a plan for all three scenarios BEFORE making the trade. Consider possible holding times. And finally, look at overall market conditions and sector/industry performance.
